 이메일
이메일 인쇄
인쇄


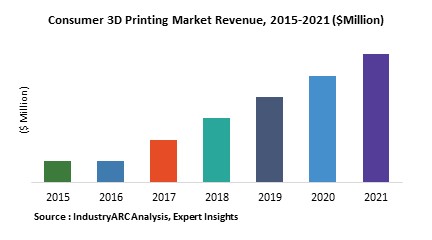
The consumer 3D Printing market was valued at $ 1,744.49 million in 2017 and is anticipated to grow at CAGR of over 22% during the forecast period 2018-2023. Consumer 3D printers are gaining prominence given the relatively low cost of the device and the ability of the device to print a product with complex design with ease. Majority of the revenue is generated from jeweler printing which accounted for over $385.02 million in revenues in 2017.Small and Medium Scale Jewelers manufacturers and design hobbyists are opting for 3D printers which produces accurate designs within a very short span of time. Huge demand for custom designs is driving the consumer 3D printer market in the jeweler segment and is anticipated to continue its dominance through the forecast period 2018-2023.
What is 3D printing?
3D printing is the process of manufacturing three dimensional objects by depositing successive layers of material through the 3D printer. It is also called as additive manufacturing. This is mainly useful for manufacturing spare parts because they are very difficult to obtain. The 3D printers have the capacity to reduce the need for traditional manufacturing processes and the costs that go with those processes like factory costs.
What are the major applications for Consumer 3D printing?
The various end users assessed include home, educational institutions, small and medium businesses, architects and designers, service providers and others. It is used in jewelry business for creating unique designs. It is used in making home decors like mugs and vases. It is used in educational institutions to give practical knowledge. This is also used in making phone cases. It is used in making toys and small sculptures.
Market Research and Market Trends of Consumer 3D Printing
- Proof of concept and prototyping are the major end user applications for consumer 3D printing. Majority of the consumers in the consumer 3D printing market use it to demonstrate a product during development phases. Clothing designers have started 3D printing cloths. This is allowing the designers not only to develop different designs but different applications such as lightweight bulletproof clothing for defense are also being prototyped using consumer 3D printers. Many companies have started to offer DIY 3D clothes printing through e-commerce sites. This allows consumers to 3D print their own designs according to their convince and re-market them.
- Consumer gifts and keepsakes, 3D printer service bureaus popping up around the world create bespoke consumer products using 3D scanner and 3D printer technologies. For example, pets, children and brides and grooms are scanned and 3D printed figurines are produced from the scans as lasting keepsakes. Common household objects are also scanned, customized and 3D printed as gifts or for personal use.
- Amazon has received a patent for new retailing systems which enables the company to process orders for custom 3D printed items. Customers can get their designs 3D printed through the service, and they receive them through the mail or pick them up. So this retailing system could bring many advantages offered by 3D printing to manufacturing projects, to the needs of an everyday consumer.
Who are the Major Players in Consumer 3D Printing market?
The companies referred in the market research report includes Stratasys, Sulpteo, Sumco Corp, Sumitomo Electric Industries, Ltd, Hitachi Metals Ltd, Mitsubishi Chemical Corporation and more than 10 other companies.
What is our report scope?
The report incorporates in-depth assessment of the competitive landscape, product market sizing, product benchmarking, market trends, product developments, financial analysis, strategic analysis and so on to gauge the impact forces and potential opportunities of the market. Apart from this the report also includes a study of major developments in the market such as product launches, agreements, acquisitions, collaborations, mergers and so on to comprehend the prevailing market dynamics at present and its impact during the forecast period 2018-2024.
All our reports are customizable to your company needs to a certain extent, we do provide 20 free consulting hours along with purchase of each report, and this will allow you to request any additional data to customize the report to your needs.
Key Takeaways from this Report
- Evaluate market potential through analyzing growth rates (CAGR %), Volume (Units) and Value ($M) data given at country level – for product types, end use applications and by different industry verticals.
- Understand the different dynamics influencing the market – key driving factors, challenges and hidden opportunities.
- Get in-depth insights on your competitor performance – market shares, strategies, financial benchmarking, product benchmarking, SWOT and more.
- Analyze the sales and distribution channels across key geographies to improve top-line revenues.
- Understand the industry supply chain with a deep-dive on the value augmentation at each step, in order to optimize value and bring efficiencies in your processes.
- Get a quick outlook on the market entropy – M&A’s, deals, partnerships, product launches of all key players for the past 4 years.
- Evaluate the supply-demand gaps, import-export statistics and regulatory landscape for more than top 20 countries globally for the market.
1. Consumer 3D Printing Market - Overview
1.1. Definitions and Scope
2. Consumer 3D Printing Market - Executive summary
2.1. Market Revenue, Market Size and Key Trends by Company
2.2. Key Trends by type of Application
2.3. Key Trends segmented by Geography
3. Consumer 3D Printing Market
3.1. Comparative analysis
3.1.1. Product Benchmarking - Top 10 companies
3.1.2. Top 5 Financials Analysis
3.1.3. Market Value split by Top 10 companies
3.1.4. Patent Analysis - Top 10 companies
3.1.5. Pricing Analysis
4. Consumer 3D Printing Market – Startup companies Scenario Premium
4.1. Top 10 startup company Analysis by
4.1.1. Investment
4.1.2. Revenue
4.1.3. Market Shares
4.1.4. Market Size and Application Analysis
4.1.5. Venture Capital and Funding Scenario
5. Consumer 3D Printing Market – Industry Market Entry Scenario Premium
5.1. Regulatory Framework Overview
5.2. New Business and Ease of Doing business index
5.3. Case studies of successful ventures
5.4. Customer Analysis – Top 10 companies
6. Consumer 3D Printing Market Forces
6.1. Drivers
6.2. Constraints
6.3. Challenges
6.4. Porters five force model
6.4.1. Bargaining power of suppliers
6.4.2. Bargaining powers of customers
6.4.3. Threat of new entrants
6.4.4. Rivalry among existing players
6.4.5. Threat of substitutes
7. Consumer 3D Printing Market - Strategic analysis
7.1. Value chain analysis
7.2. Opportunities analysis
7.3. Product life cycle
7.4. Suppliers and distributors Market Share
8. Consumer 3D Printing Market – By Type (Market Size -$Million / $Billion)
8.1. Market Size and Market Share Analysis
8.2. Application Revenue and Trend Research
8.3. Product Segment Analysis
8.3.1. Software
8.3.1.1. Design
8.3.1.2. Inspection
8.3.1.3. Scanning
8.3.1.4. Printing
8.3.2. Hardware
8.3.3. Services
8.3.3.1. Rapid Prototyping
8.3.3.2. Parts on Demand
8.3.3.3. Others
9. Consumer 3D Printing Market – By Materials Used (Market Size -$Million / $Billion)
9.1. Plastics
9.1.1. Poly lactic acid (PLA)
9.1.2. Acrylonitrile, Butadiene and Styrene(ABS)
9.1.3. Polyethylene terephthalate (PET)
9.1.4. Polyvinyl alcohol(PVA)
9.1.5. Grey Plastic
9.1.6. Black Plastic
9.1.7. Flexible Plastic
9.1.8. Alumide
9.1.9. Glass Filled Nylon
9.1.10. Carbon Mide
9.1.11. HP Solid Black Plastic
9.1.12. PEBA
9.2. Metals
9.2.1. Aluminium
9.2.2. Titanium
9.2.3. Stainless Steel
9.2.4. Brass
9.2.5. Silver
9.2.6. Nickel
9.2.7. Gold
9.2.8. Bronze
9.2.9. Copper
9.2.10. Iron
9.2.11. Manganese
9.2.12. Others
9.3. Ceramics
9.3.1. Quartz
9.3.2. Glass
9.3.3. Silica
9.3.4. Others
9.4. Resins
9.4.1. Opaque Polyjet Resin
9.4.2. Trasnlucent Polyjet Resin
9.4.3. Arcylate
9.4.4. Rigid Polyurethane
9.4.5. Elastometric Polyurethane
9.4.6. Cynate Ester
9.4.7. Flexible Polyurethane
9.5. Fiber
9.5.1. Carbon
9.5.2. Glass
9.5.3. Kevlar
9.5.4. Others
10. Consumer 3D Printing Market – By Technology (Market Size -$Million / $Billion)
10.1. Fused Deposition Modeling (FDM) Technology
10.2. Stereolithography (SLA)
10.3. Digital Light Processing (DLP)
10.4. Continuous Liquid Interface Production (CLIP)
10.5. Selective Laser Sintering (SLS) technology
10.6. Selective Deposition Lamination
10.7. Multi Jet Fusion
10.8. Polyjet
10.10. Selective Laser Melting (SLM)
10.10. Electron Beam Melting (EBM)
10.11. Direct Metal Laser Sintering (DMLS) technology
10.12. Binder Jetting
10.13. Casting
10.14. Others
11. Consumer 3D Printing Market – By form (Market Size -$Million / $Billion)
11.1. Filament
11.2. Powder
11.3. Liquids
12. Consumer 3D Printing Market – By Additive Manufacturing Process (Market Size -$Million / $Billion)
12.1. Material Extrusion
12.2. Powder Bed Fusion
12.3. Photopoly- merisation
12.4. Material Jetting
12.5. Sheet Lamination
13. Consumer 3D Printing Market – By Applications (Market Size -$Million / $Billion)
13.1. Jewelry
13.2. Apparels and Footwear
13.3. Miniatures
13.4. Art Projects
13.5. Furniture/ Home Décor
13.6. Repairs
13.7. Remote Control Cars
13.8. Kitchen ware / utensils
13.13. Games
13.10. Electronics
13.10.1. Casing for electronic devices
13.10.2. Spare parts
13.11. Others
14. Consumer 3D Printing – By End Use Industry(Market Size -$Million / $Billion)
14.1. Segment type Size and Market Share Analysis
14.2. Application Revenue and Trends by type of Application
14.3. Application Segment Analysis by Type
14.3.1. Residential
14.3.2. Educational Institutions
14.3.3. Industrial
14.3.3.1. Small and Medium Business
14.3.3.2. Architects and Designers
14.3.4. Others
15. Consumer 3D Printing - By Geography (Market Size -$Million / $Billion)
15.1. Consumer 3D Printing Market - North America Segment Research
15.2. North America Market Research (Million / $Billion)
15.2.1. Segment type Size and Market Size Analysis
15.2.2. Revenue and Trends
15.2.3. Application Revenue and Trends by type of Application
15.2.4. Company Revenue and Product Analysis
15.2.5. North America Product type and Application Market Size
15.2.5.1. U.S.
15.2.5.2. Canada
15.2.5.3. Mexico
15.2.5.4. Rest of North America
15.3. Consumer 3D Printing - South America Segment Research
15.4. South America Market Research (Market Size -$Million / $Billion)
15.4.1. Segment type Size and Market Size Analysis
15.4.2. Revenue and Trends
15.4.3. Application Revenue and Trends by type of Application
15.4.4. Company Revenue and Product Analysis
15.4.5. South America Product type and Application Market Size
15.4.5.1. Brazil
15.4.5.2. Venezuela
15.4.5.3. Argentina
15.4.5.4. Ecuador
15.4.5.5. Peru
15.4.5.6. Colombia
15.4.5.7. Costa Rica
15.4.5.8. Rest of South America
15.5. Consumer 3D Printing - Europe Segment Research
15.6. Europe Market Research (Market Size -$Million / $Billion)
15.6.1. Segment type Size and Market Size Analysis
15.6.2. Revenue and Trends
15.6.3. Application Revenue and Trends by type of Application
15.6.4. Company Revenue and Product Analysis
15.6.5. Europe Segment Product type and Application Market Size
15.6.5.1. U.K
15.6.5.2. Germany
15.6.5.3. Italy
15.6.5.4. France
15.6.5.5. Netherlands
15.6.5.6. Belgium
15.6.5.7. Spain
15.6.5.8. Denmark
15.6.5.9. Rest of Europe
15.7. Consumer 3D Printing – APAC Segment Research
15.8. APAC Market Research (Market Size -$Million / $Billion)
15.8.1. Segment type Size and Market Size Analysis
15.8.2. Revenue and Trends
15.8.3. Application Revenue and Trends by type of Application
15.8.4. Company Revenue and Product Analysis
15.8.5. APAC Segment – Product type and Application Market Size
15.8.5.1. China
15.8.5.2. Australia
15.8.5.3. Japan
15.8.5.4. South Korea
15.8.5.5. India
15.8.5.6. Taiwan
15.8.5.7. Malaysia
16. Consumer 3D Printing Market - Entropy
16.1. New product launches
16.2. M&A's, collaborations, JVs and partnerships
17. Consumer 3D Printing Market – Industry / Segment Competition landscape Premium
17.1. Market Share Analysis
17.1.1. Market Share by Country- Top companies
17.1.2. Market Share by Region- Top 10 companies
17.1.3. Market Share by type of Application – Top 10 companies
17.1.4. Market Share by type of Product / Product category- Top 10 companies
17.1.5. Market Share at global level- Top 10 companies
17.1.6. Best Practises for companies
18. Consumer 3D Printing Market – Key Company List by Country Premium
19. Consumer 3D Printing Market Company Analysis
19.1. Market Share, Company Revenue, Products, M&A, Developments
19.2. Stratasys
19.3. Sulpteo
19.4. Sumco Corp
19.5. Sumitomo Electric Industries, Ltd
19.6. Hitachi Metals Ltd
19.7. Mitsubishi Chemical Corporation
19.8. Company 7
19.9. Company 8
19.10. Company 9
19.11. Company 10 and more
"*Financials would be provided on a best efforts basis for private companies"
20. Consumer 3D Printing Market - Appendix
20.1. Abbreviations
20.2. Sources
21. Consumer 3D Printing Market - Methodology
21.1. Research Methodology
21.1.1. Company Expert Interviews
21.1.2. Industry Databases
21.1.3. Associations
21.1.4. Company News
21.1.5. Company Annual Reports
21.1.6. Application Trends
21.1.7. New Products and Product database
21.1.8. Company Transcripts
21.1.9. R&D Trends
21.1.10. Key Opinion Leaders Interviews
21.1.11. Supply and Demand Trends
List of Tables
Table 1: Consumer 3D Printing Market Overview 2019-2024
Table 2: Consumer 3D Printing Market Leader Analysis 2018-2019 (US$)
Table 3: Consumer 3D Printing Market Product Analysis 2018-2019 (US$)
Table 4: Consumer 3D Printing Market End User Analysis 2018-2019 (US$)
Table 5: Consumer 3D Printing Market Patent Analysis 2013-2018* (US$)
Table 6: Consumer 3D Printing Market Financial Analysis 2018-2019 (US$)
Table 7: Consumer 3D Printing Market Driver Analysis 2018-2019 (US$)
Table 8: Consumer 3D Printing Market Challenges Analysis 2018-2019 (US$)
Table 9: Consumer 3D Printing Market Constraint Analysis 2018-2019 (US$)
Table 10: Consumer 3D Printing Market Supplier Bargaining Power Analysis 2018-2019 (US$)
Table 11: Consumer 3D Printing Market Buyer Bargaining Power Analysis 2018-2019 (US$)
Table 12: Consumer 3D Printing Market Threat of Substitutes Analysis 2018-2019 (US$)
Table 13: Consumer 3D Printing Market Threat of New Entrants Analysis 2018-2019 (US$)
Table 14: Consumer 3D Printing Market Degree of Competition Analysis 2018-2019 (US$)
Table 15: Consumer 3D Printing Market Value Chain Analysis 2018-2019 (US$)
Table 16: Consumer 3D Printing Market Pricing Analysis 2019-2024 (US$)
Table 17: Consumer 3D Printing Market Opportunities Analysis 2019-2024 (US$)
Table 18: Consumer 3D Printing Market Product Life Cycle Analysis 2019-2024 (US$)
Table 19: Consumer 3D Printing Market Supplier Analysis 2018-2019 (US$)
Table 20: Consumer 3D Printing Market Distributor Analysis 2018-2019 (US$)
Table 21: Consumer 3D Printing Market Trend Analysis 2018-2019 (US$)
Table 22: Consumer 3D Printing Market Size 2018 (US$)
Table 23: Consumer 3D Printing Market Forecast Analysis 2019-2024 (US$)
Table 24: Consumer 3D Printing Market Sales Forecast Analysis 2019-2024 (Units)
Table 25: Consumer 3D Printing Market, Revenue & Volume,By Type, 2019-2024 ($)
Table 26: Consumer 3D Printing Market By Type, Revenue & Volume,By Hardware, 2019-2024 ($)
Table 27: Consumer 3D Printing Market By Type, Revenue & Volume,By Software, 2019-2024 ($)
Table 28: Consumer 3D Printing Market By Type, Revenue & Volume,By Services, 2019-2024 ($)
Table 29: Consumer 3D Printing Market, Revenue & Volume, By Materials Used, 2019-2024 ($)
Table 30: Consumer 3D Printing Market By Materials Used, Revenue & Volume,By Plastics, 2019-2024 ($)
Table 31: Consumer 3D Printing Market By Materials Used, Revenue & Volume,By Metals, 2019-2024 ($)
Table 32: Consumer 3D Printing Market By Materials Used, Revenue & Volume,By Ceramics, 2019-2024 ($)
Table 33: Consumer 3D Printing Market By Materials Used, Revenue & Volume,By Resins, 2019-2024 ($)
Table 34: Consumer 3D Printing Market By Materials Used, Revenue & Volume,By Fiber, 2019-2024 ($)
Table 35: Consumer 3D Printing Market, Revenue & Volume,By Technology, 2019-2024 ($)
Table 36: Consumer 3D Printing Market By Technology, Revenue & Volume,By Fused Deposition Modeling (FDM) Technology, 2019-2024 ($)
Table 37: Consumer 3D Printing Market By Technology, Revenue & Volume,By Stereolithography (SLA), 2019-2024 ($)
Table 38: Consumer 3D Printing Market By Technology, Revenue & Volume,By Digital Light Processing (DLP), 2019-2024 ($)
Table 39: Consumer 3D Printing Market By Technology, Revenue & Volume,By Continuous Liquid Interface Production (CLIP), 2019-2024 ($)
Table 40: Consumer 3D Printing Market By Technology, Revenue & Volume,By Selective Laser Sintering (SLS) technology, 2019-2024 ($)
Table 41: Consumer 3D Printing Market, Revenue & Volume,By Application, 2019-2024 ($)
Table 42: Consumer 3D Printing Market By Application, Revenue & Volume,By Jewelry, 2019-2024 ($)
Table 43: Consumer 3D Printing Market By Application, Revenue & Volume,By Apparels and Footwear, 2019-2024 ($)
Table 44: Consumer 3D Printing Market By Application, Revenue & Volume,By Miniatures, 2019-2024 ($)
Table 45: Consumer 3D Printing Market By Application, Revenue & Volume,By Art Projects, 2019-2024 ($)
Table 46: Consumer 3D Printing Market By Application, Revenue & Volume,By Furniture/ Home Décor, 2019-2024 ($)
Table 47: Consumer 3D Printing Market, Revenue & Volume,By End Use, 2019-2024 ($)
Table 48: Consumer 3D Printing Market By End Use, Revenue & Volume,By Residential, 2019-2024 ($)
Table 49: Consumer 3D Printing Market By End Use, Revenue & Volume,By Educational Institutions, 2019-2024 ($)
Table 50: Consumer 3D Printing Market By End Use, Revenue & Volume,By Industrial, 2019-2024 ($)
Table 51: North America Consumer 3D Printing Market, Revenue & Volume,By Type, 2019-2024 ($)
Table 52: North America Consumer 3D Printing Market, Revenue & Volume, By Materials Used, 2019-2024 ($)
Table 53: North America Consumer 3D Printing Market, Revenue & Volume,By Technology, 2019-2024 ($)
Table 54: North America Consumer 3D Printing Market, Revenue & Volume,By Application, 2019-2024 ($)
Table 55: North America Consumer 3D Printing Market, Revenue & Volume,By End Use, 2019-2024 ($)
Table 56: South america Consumer 3D Printing Market, Revenue & Volume,By Type, 2019-2024 ($)
Table 57: South america Consumer 3D Printing Market, Revenue & Volume, By Materials Used, 2019-2024 ($)
Table 58: South america Consumer 3D Printing Market, Revenue & Volume,By Technology, 2019-2024 ($)
Table 59: South america Consumer 3D Printing Market, Revenue & Volume,By Application, 2019-2024 ($)
Table 60: South america Consumer 3D Printing Market, Revenue & Volume,By End Use, 2019-2024 ($)
Table 61: Europe Consumer 3D Printing Market, Revenue & Volume,By Type, 2019-2024 ($)
Table 62: Europe Consumer 3D Printing Market, Revenue & Volume, By Materials Used, 2019-2024 ($)
Table 63: Europe Consumer 3D Printing Market, Revenue & Volume,By Technology, 2019-2024 ($)
Table 64: Europe Consumer 3D Printing Market, Revenue & Volume,By Application, 2019-2024 ($)
Table 65: Europe Consumer 3D Printing Market, Revenue & Volume,By End Use, 2019-2024 ($)
Table 66: APAC Consumer 3D Printing Market, Revenue & Volume,By Type, 2019-2024 ($)
Table 67: APAC Consumer 3D Printing Market, Revenue & Volume, By Materials Used, 2019-2024 ($)
Table 68: APAC Consumer 3D Printing Market, Revenue & Volume,By Technology, 2019-2024 ($)
Table 69: APAC Consumer 3D Printing Market, Revenue & Volume,By Application, 2019-2024 ($)
Table 70: APAC Consumer 3D Printing Market, Revenue & Volume,By End Use, 2019-2024 ($)
Table 71: Middle East & Africa Consumer 3D Printing Market, Revenue & Volume,By Type, 2019-2024 ($)
Table 72: Middle East & Africa Consumer 3D Printing Market, Revenue & Volume, By Materials Used, 2019-2024 ($)
Table 73: Middle East & Africa Consumer 3D Printing Market, Revenue & Volume,By Technology, 2019-2024 ($)
Table 74: Middle East & Africa Consumer 3D Printing Market, Revenue & Volume,By Application, 2019-2024 ($)
Table 75: Middle East & Africa Consumer 3D Printing Market, Revenue & Volume,By End Use, 2019-2024 ($)
Table 76: Russia Consumer 3D Printing Market, Revenue & Volume,By Type, 2019-2024 ($)
Table 77: Russia Consumer 3D Printing Market, Revenue & Volume, By Materials Used, 2019-2024 ($)
Table 78: Russia Consumer 3D Printing Market, Revenue & Volume,By Technology, 2019-2024 ($)
Table 79: Russia Consumer 3D Printing Market, Revenue & Volume,By Application, 2019-2024 ($)
Table 80: Russia Consumer 3D Printing Market, Revenue & Volume,By End Use, 2019-2024 ($)
Table 81: Israel Consumer 3D Printing Market, Revenue & Volume,By Type, 2019-2024 ($)
Table 82: Israel Consumer 3D Printing Market, Revenue & Volume, By Materials Used, 2019-2024 ($)
Table 83: Israel Consumer 3D Printing Market, Revenue & Volume,By Technology, 2019-2024 ($)
Table 84: Israel Consumer 3D Printing Market, Revenue & Volume,By Application, 2019-2024 ($)
Table 85: Israel Consumer 3D Printing Market, Revenue & Volume,By End Use, 2019-2024 ($)
Table 86: Top Companies 2018 (US$)Consumer 3D Printing Market, Revenue & Volume
Table 87: Product Launch 2018-2019Consumer 3D Printing Market, Revenue & Volume
Table 88: Mergers & Acquistions 2018-2019Consumer 3D Printing Market, Revenue & Volume
List of Figures
Figure 1: Overview of Consumer 3D Printing Market 2019-2024
Figure 2: Market Share Analysis for Consumer 3D Printing Market 2018 (US$)
Figure 3: Product Comparison in Consumer 3D Printing Market 2018-2019 (US$)
Figure 4: End User Profile for Consumer 3D Printing Market 2018-2019 (US$)
Figure 5: Patent Application and Grant in Consumer 3D Printing Market 2013-2018* (US$)
Figure 6: Top 5 Companies Financial Analysis in Consumer 3D Printing Market 2018-2019 (US$)
Figure 7: Market Entry Strategy in Consumer 3D Printing Market 2018-2019
Figure 8: Ecosystem Analysis in Consumer 3D Printing Market 2018
Figure 9: Average Selling Price in Consumer 3D Printing Market 2019-2024
Figure 10: Top Opportunites in Consumer 3D Printing Market 2018-2019
Figure 11: Market Life Cycle Analysis in Consumer 3D Printing Market Market Life Cycle Analysis in 3D Printing
Figure 12: GlobalBy TypeConsumer 3D Printing Market Revenue, 2019-2024 ($)
Figure 13: Global By Materials UsedConsumer 3D Printing Market Revenue, 2019-2024 ($)
Figure 14: GlobalBy TechnologyConsumer 3D Printing Market Revenue, 2019-2024 ($)
Figure 15: GlobalBy ApplicationConsumer 3D Printing Market Revenue, 2019-2024 ($)
Figure 16: GlobalBy End UseConsumer 3D Printing Market Revenue, 2019-2024 ($)
Figure 17: Global Consumer 3D Printing Market - By Geography
Figure 18: Global Consumer 3D Printing Market Value & Volume, By Geography, 2019-2024 ($)
Figure 19: Global Consumer 3D Printing Market CAGR, By Geography, 2019-2024 (%)
Figure 20: North America Consumer 3D Printing Market Value & Volume, 2019-2024 ($)
Figure 21: US Consumer 3D Printing Market Value & Volume, 2019-2024 ($)
Figure 22: US GDP and Population, 2018-2019 ($)
Figure 23: US GDP – Composition of 2018, By Sector of Origin
Figure 24: US Export and Import Value & Volume, 2018-2019 ($)
Figure 25: Canada Consumer 3D Printing Market Value & Volume, 2019-2024 ($)
Figure 26: Canada GDP and Population, 2018-2019 ($)
Figure 27: Canada GDP – Composition of 2018, By Sector of Origin
Figure 28: Canada Export and Import Value & Volume, 2018-2019 ($)
Figure 29: Mexico Consumer 3D Printing Market Value & Volume, 2019-2024 ($)
Figure 30: Mexico GDP and Population, 2018-2019 ($)
Figure 31: Mexico GDP – Composition of 2018, By Sector of Origin
Figure 32: Mexico Export and Import Value & Volume, 2018-2019 ($)
Figure 33: South America Consumer 3D Printing Market South America 3D Printing Market Value & Volume, 2019-2024 ($)
Figure 34: Brazil Consumer 3D Printing Market Value & Volume, 2019-2024 ($)
Figure 35: Brazil GDP and Population, 2018-2019 ($)
Figure 36: Brazil GDP – Composition of 2018, By Sector of Origin
Figure 37: Brazil Export and Import Value & Volume, 2018-2019 ($)
Figure 38: Venezuela Consumer 3D Printing Market Value & Volume, 2019-2024 ($)
Figure 39: Venezuela GDP and Population, 2018-2019 ($)
Figure 40: Venezuela GDP – Composition of 2018, By Sector of Origin
Figure 41: Venezuela Export and Import Value & Volume, 2018-2019 ($)
Figure 42: Argentina Consumer 3D Printing Market Value & Volume, 2019-2024 ($)
Figure 43: Argentina GDP and Population, 2018-2019 ($)
Figure 44: Argentina GDP – Composition of 2018, By Sector of Origin
Figure 45: Argentina Export and Import Value & Volume, 2018-2019 ($)
Figure 46: Ecuador Consumer 3D Printing Market Value & Volume, 2019-2024 ($)
Figure 47: Ecuador GDP and Population, 2018-2019 ($)
Figure 48: Ecuador GDP – Composition of 2018, By Sector of Origin
Figure 49: Ecuador Export and Import Value & Volume, 2018-2019 ($)
Figure 50: Peru Consumer 3D Printing Market Value & Volume, 2019-2024 ($)
Figure 51: Peru GDP and Population, 2018-2019 ($)
Figure 52: Peru GDP – Composition of 2018, By Sector of Origin
Figure 53: Peru Export and Import Value & Volume, 2018-2019 ($)
Figure 54: Colombia Consumer 3D Printing Market Value & Volume, 2019-2024 ($)
Figure 55: Colombia GDP and Population, 2018-2019 ($)
Figure 56: Colombia GDP – Composition of 2018, By Sector of Origin
Figure 57: Colombia Export and Import Value & Volume, 2018-2019 ($)
Figure 58: Costa Rica Consumer 3D Printing Market Costa Rica 3D Printing Market Value & Volume, 2019-2024 ($)
Figure 59: Costa Rica GDP and Population, 2018-2019 ($)
Figure 60: Costa Rica GDP – Composition of 2018, By Sector of Origin
Figure 61: Costa Rica Export and Import Value & Volume, 2018-2019 ($)
Figure 62: Europe Consumer 3D Printing Market Value & Volume, 2019-2024 ($)
Figure 63: U.K Consumer 3D Printing Market Value & Volume, 2019-2024 ($)
Figure 64: U.K GDP and Population, 2018-2019 ($)
Figure 65: U.K GDP – Composition of 2018, By Sector of Origin
Figure 66: U.K Export and Import Value & Volume, 2018-2019 ($)
Figure 67: Germany Consumer 3D Printing Market Value & Volume, 2019-2024 ($)
Figure 68: Germany GDP and Population, 2018-2019 ($)
Figure 69: Germany GDP – Composition of 2018, By Sector of Origin
Figure 70: Germany Export and Import Value & Volume, 2018-2019 ($)
Figure 71: Italy Consumer 3D Printing Market Value & Volume, 2019-2024 ($)
Figure 72: Italy GDP and Population, 2018-2019 ($)
Figure 73: Italy GDP – Composition of 2018, By Sector of Origin
Figure 74: Italy Export and Import Value & Volume, 2018-2019 ($)
Figure 75: France Consumer 3D Printing Market Value & Volume, 2019-2024 ($)
Figure 76: France GDP and Population, 2018-2019 ($)
Figure 77: France GDP – Composition of 2018, By Sector of Origin
Figure 78: France Export and Import Value & Volume, 2018-2019 ($)
Figure 79: Netherlands Consumer 3D Printing Market Value & Volume, 2019-2024 ($)
Figure 80: Netherlands GDP and Population, 2018-2019 ($)
Figure 81: Netherlands GDP – Composition of 2018, By Sector of Origin
Figure 82: Netherlands Export and Import Value & Volume, 2018-2019 ($)
Figure 83: Belgium Consumer 3D Printing Market Value & Volume, 2019-2024 ($)
Figure 84: Belgium GDP and Population, 2018-2019 ($)
Figure 85: Belgium GDP – Composition of 2018, By Sector of Origin
Figure 86: Belgium Export and Import Value & Volume, 2018-2019 ($)
Figure 87: Spain Consumer 3D Printing Market Value & Volume, 2019-2024 ($)
Figure 88: Spain GDP and Population, 2018-2019 ($)
Figure 89: Spain GDP – Composition of 2018, By Sector of Origin
Figure 90: Spain Export and Import Value & Volume, 2018-2019 ($)
Figure 91: Denmark Consumer 3D Printing Market Value & Volume, 2019-2024 ($)
Figure 92: Denmark GDP and Population, 2018-2019 ($)
Figure 93: Denmark GDP – Composition of 2018, By Sector of Origin
Figure 94: Denmark Export and Import Value & Volume, 2018-2019 ($)
Figure 95: APAC Consumer 3D Printing Market Value & Volume, 2019-2024 ($)
Figure 96: China Consumer 3D Printing Market Value & Volume, 2019-2024
Figure 97: China GDP and Population, 2018-2019 ($)
Figure 98: China GDP – Composition of 2018, By Sector of Origin
Figure 99: China Export and Import Value & Volume, 2018-2019 ($)Consumer 3D Printing Market China Export and Import Value & Volume, 2018-2019 ($)
Figure 100: Australia Consumer 3D Printing Market Value & Volume, 2019-2024 ($)
Figure 101: Australia GDP and Population, 2018-2019 ($)
Figure 102: Australia GDP – Composition of 2018, By Sector of Origin
Figure 103: Australia Export and Import Value & Volume, 2018-2019 ($)
Figure 104: South Korea Consumer 3D Printing Market Value & Volume, 2019-2024 ($)
Figure 105: South Korea GDP and Population, 2018-2019 ($)
Figure 106: South Korea GDP – Composition of 2018, By Sector of Origin
Figure 107: South Korea Export and Import Value & Volume, 2018-2019 ($)
Figure 108: India Consumer 3D Printing Market Value & Volume, 2019-2024 ($)
Figure 109: India GDP and Population, 2018-2019 ($)
Figure 110: India GDP – Composition of 2018, By Sector of Origin
Figure 111: India Export and Import Value & Volume, 2018-2019 ($)
Figure 112: Taiwan Consumer 3D Printing Market Taiwan 3D Printing Market Value & Volume, 2019-2024 ($)
Figure 113: Taiwan GDP and Population, 2018-2019 ($)
Figure 114: Taiwan GDP – Composition of 2018, By Sector of Origin
Figure 115: Taiwan Export and Import Value & Volume, 2018-2019 ($)
Figure 116: Malaysia Consumer 3D Printing Market Malaysia 3D Printing Market Value & Volume, 2019-2024 ($)
Figure 117: Malaysia GDP and Population, 2018-2019 ($)
Figure 118: Malaysia GDP – Composition of 2018, By Sector of Origin
Figure 119: Malaysia Export and Import Value & Volume, 2018-2019 ($)
Figure 120: Hong Kong Consumer 3D Printing Market Hong Kong 3D Printing Market Value & Volume, 2019-2024 ($)
Figure 121: Hong Kong GDP and Population, 2018-2019 ($)
Figure 122: Hong Kong GDP – Composition of 2018, By Sector of Origin
Figure 123: Hong Kong Export and Import Value & Volume, 2018-2019 ($)
Figure 124: Middle East & Africa Consumer 3D Printing Market Middle East & Africa 3D Printing Market Value & Volume, 2019-2024 ($)
Figure 125: Russia Consumer 3D Printing Market Russia 3D Printing Market Value & Volume, 2019-2024 ($)
Figure 126: Russia GDP and Population, 2018-2019 ($)
Figure 127: Russia GDP – Composition of 2018, By Sector of Origin
Figure 128: Russia Export and Import Value & Volume, 2018-2019 ($)
Figure 129: Israel Consumer 3D Printing Market Value & Volume, 2019-2024 ($)
Figure 130: Israel GDP and Population, 2018-2019 ($)
Figure 131: Israel GDP – Composition of 2018, By Sector of Origin
Figure 132: Israel Export and Import Value & Volume, 2018-2019 ($)
Figure 133: Entropy Share, By Strategies, 2018-2019* (%)Consumer 3D Printing Market
Figure 134: Developments, 2018-2019*Consumer 3D Printing Market
Figure 135: Company 1 Consumer 3D Printing Market Net Revenue, By Years, 2018-2019* ($)
Figure 136: Company 1 Consumer 3D Printing Market Net Revenue Share, By Business segments, 2018 (%)
Figure 137: Company 1 Consumer 3D Printing Market Net Sales Share, By Geography, 2018 (%)
Figure 138: Company 2 Consumer 3D Printing Market Net Revenue, By Years, 2018-2019* ($)
Figure 139: Company 2 Consumer 3D Printing Market Net Revenue Share, By Business segments, 2018 (%)
Figure 140: Company 2 Consumer 3D Printing Market Net Sales Share, By Geography, 2018 (%)
Figure 141: Company 3Consumer 3D Printing Market Net Revenue, By Years, 2018-2019* ($)
Figure 142: Company 3Consumer 3D Printing Market Net Revenue Share, By Business segments, 2018 (%)
Figure 143: Company 3Consumer 3D Printing Market Net Sales Share, By Geography, 2018 (%)
Figure 144: Company 4 Consumer 3D Printing Market Net Revenue, By Years, 2018-2019* ($)
Figure 145: Company 4 Consumer 3D Printing Market Net Revenue Share, By Business segments, 2018 (%)
Figure 146: Company 4 Consumer 3D Printing Market Net Sales Share, By Geography, 2018 (%)
Figure 147: Company 5 Consumer 3D Printing Market Net Revenue, By Years, 2018-2019* ($)
Figure 148: Company 5 Consumer 3D Printing Market Net Revenue Share, By Business segments, 2018 (%)
Figure 149: Company 5 Consumer 3D Printing Market Net Sales Share, By Geography, 2018 (%)
Figure 150: Company 6 Consumer 3D Printing Market Net Revenue, By Years, 2018-2019* ($)
Figure 151: Company 6 Consumer 3D Printing Market Net Revenue Share, By Business segments, 2018 (%)
Figure 152: Company 6 Consumer 3D Printing Market Net Sales Share, By Geography, 2018 (%)
Figure 153: Company 7 Consumer 3D Printing Market Net Revenue, By Years, 2018-2019* ($)
Figure 154: Company 7 Consumer 3D Printing Market Net Revenue Share, By Business segments, 2018 (%)
Figure 155: Company 7 Consumer 3D Printing Market Net Sales Share, By Geography, 2018 (%)
Figure 156: Company 8 Consumer 3D Printing Market Net Revenue, By Years, 2018-2019* ($)
Figure 157: Company 8 Consumer 3D Printing Market Net Revenue Share, By Business segments, 2018 (%)
Figure 158: Company 8 Consumer 3D Printing Market Net Sales Share, By Geography, 2018 (%)
Figure 159: Company 9 Consumer 3D Printing Market Net Revenue, By Years, 2018-2019* ($)
Figure 160: Company 9 Consumer 3D Printing Market Net Revenue Share, By Business segments, 2018 (%)
Figure 161: Company 9 Consumer 3D Printing Market Net Sales Share, By Geography, 2018 (%)
Figure 162: Company 10 Consumer 3D Printing Market Net Revenue, By Years, 2018-2019* ($)
Figure 163: Company 10 Consumer 3D Printing Market Net Revenue Share, By Business segments, 2018 (%)
Figure 164: Company 10 Consumer 3D Printing Market Net Sales Share, By Geography, 2018 (%)
Figure 165: Company 11 Consumer 3D Printing Market Net Revenue, By Years, 2018-2019* ($)
Figure 166: Company 11 Consumer 3D Printing Market Net Revenue Share, By Business segments, 2018 (%)
Figure 167: Company 11 Consumer 3D Printing Market Net Sales Share, By Geography, 2018 (%)
Figure 168: Company 12 Consumer 3D Printing Market Net Revenue, By Years, 2018-2019* ($)
Figure 169: Company 12 Consumer 3D Printing Market Net Revenue Share, By Business segments, 2018 (%)
Figure 170: Company 12 Consumer 3D Printing Market Net Sales Share, By Geography, 2018 (%)
Figure 171: Company 13Consumer 3D Printing Market Net Revenue, By Years, 2018-2019* ($)
Figure 172: Company 13Consumer 3D Printing Market Net Revenue Share, By Business segments, 2018 (%)
Figure 173: Company 13Consumer 3D Printing Market Net Sales Share, By Geography, 2018 (%)
Figure 174: Company 14 Consumer 3D Printing Market Net Revenue, By Years, 2018-2019* ($)
Figure 175: Company 14 Consumer 3D Printing Market Net Revenue Share, By Business segments, 2018 (%)
Figure 176: Company 14 Consumer 3D Printing Market Net Sales Share, By Geography, 2018 (%)
Figure 177: Company 15 Consumer 3D Printing Market Net Revenue, By Years, 2018-2019* ($)
Figure 178: Company 15 Consumer 3D Printing Market Net Revenue Share, By Business segments, 2018 (%)
Figure 179: Company 15 Consumer 3D Printing Market Net Sales Share, By Geography, 2018 (%)