 이메일
이메일 인쇄
인쇄


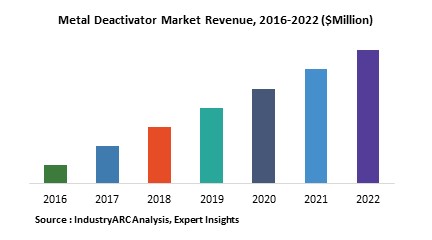
The Global Metal Deactivator market by various regions contributed a revenue of $177.5 million in 2017 and is expected to grow with a CAGR of 5.3% during the forecast period 2018 – 2023. The Metal deactivators market was dominated by the copper metal as it is the most prevalent compound found which is known to cause corrosion and filter problems. It generated a revenue of $95.5 million in 2017 and expected rise with CAGR of 5.7% during 2018 -2023. Metal deactivators market is attaining a stagnant growth owing to its usage in various applications. However, the growing automotive and polymer industries is set to increase the market share for Metal Deactivator market during the forecast period.
What are Metal Deactivators?
Metal deactivators are kind of fuel and oil additives, which are largely used for stabilizing fluids. These are variant of fuel additives which helps to stabilize the fluids by disabling metal ions present in fluids to make them inactive as oxidation catalyst. These deactivators also acts as stabilizing agent for non-ferrous metals. These are majorly used to neutralize catalytic effects in lubricants which largely cause corrosion and staining and also to utilize antioxidants. As antioxidants are considered as very expensive chemical to cut down these chemical very few metal deactivators are needed.
Based on their solubility, metal deactivators are classified as water soluble and oil soluble. A metal deactivator prohibits or reduces the interaction between the metal surface and chemicals contained within the additive and thus prevents oxidation and corrosion. The metal deactivators form an inactive barrier film that inhibit the reactions that catalyze oxidation or cause corrosion. The selection of metal deactivators depends on the metal to be protected, base stock used in the application, frequency of application and effectiveness based on the duration of application.
What are the applications of Metal Deactivators?
Metal deactivators have wide range of applications in various industries such as automotive, aviation, polymers, food and agriculture. The use of wire and cable in polymer industries is subjected to oxidative degradation by copper or other metals present in or in contact with polymers. This can be prevented by the addition of a metal deactivator which counteracts this process. In the automotive industry, metal deactivators prevents the oxidation process caused due to the interaction between non -ferrous metals in automobile parts and fuels like gasoline and diesel. To prevent oxidation and metal contamination automotive and industrial sector utilize metal deactivators. The development of automotive and industrial sector is expected expand the market size of metal deactivators.
Market Research and Market Trends of Metal Deactivators:
- There has been a great demand for formaldehyde free metal deactivators in the market. Several companies are manufacturing non-toxic metal deactivators in order to eliminate formaldehyde derivatives. Companies are also focusing on improved solubility of metal deactivators in nonpolar solvents as it is necessary with increase in its uses.
- OKABEST PAT 550B is new kind of metal deactivator and antioxidant manufactured by Oka-Tec. It is particular suitable for pipes, cables and reprocessed polyolefin compounds which are exposed ions from various metals such as copper, brass and other transition metals. This innovative and multifunctional solution provides longer stabilization performance when compared to the commonly used metal deactivators. According to market overview of metal deactivators this new kind of product expected to earn a huge market share.
- The increasing use of nonferrous alloys in lubrication systems has raised the demand of metal deactivators to protect against premature deterioration. The development of new metal deactivators or multifunctional additives is under development as it would enhance their performance profile by including the desired properties required for various applications.
- The increase in the use of transition and reactive metals in the metal working industry has led to improvement in the additives such as better toxicity profiles, improved thermal and hydrolytic stability. The current focus of the manufacturers is to develop metal deactivators that offer thermal stability are compatibility with other additives as well. Due to stringent regulations set up by government authorities along with environment protection bodies, manufacturing of metal deactivators which are less toxic and less harmful to the environment are in great demand.
Who are the Major Players in Metal Deactivators Market?
The companies referred in the market research report are BASF SE (Germany), Innospec Inc. (U.S.), Clariant AG (Europe), Vanderbilt Chemicals LLC (U.S.), The Lubrizol Corporation, Adeka Corporation and 10 others.
What is our report scope?
The report incorporates in-depth assessment of the competitive landscape, product market sizing, product benchmarking, market trends, product developments, financial analysis, strategic analysis and so on to gauge the impact forces and potential opportunities of the market. Apart from this the report also includes a study of major developments in the market such as product launches, agreements, acquisitions, collaborations, mergers and so on to comprehend the prevailing market dynamics at present and its impact during the forecast period 2018-2023.
All our reports are customizable to your company needs to a certain extent, we do provide 20 free consulting hours along with purchase of each report, and this will allow you to request any additional data to customize the report to your needs.
Key Takeaways from this Report
- Evaluate market potential through analyzing growth rates (CAGR %), Volume (Units) and Value ($M) data given at country level – for product types, end use applications and by different industry verticals.
- Understand the different dynamics influencing the market – key driving factors, challenges and hidden opportunities.
- Get in-depth insights on your competitor performance – market shares, strategies, financial benchmarking, product benchmarking, SWOT and more.
- Analyze the sales and distribution channels across key geographies to improve top-line revenues.
- Understand the industry supply chain with a deep-dive on the value augmentation at each step, in order to optimize value and bring efficiencies in your processes.
- Get a quick outlook on the market entropy – M&A’s, deals, partnerships, product launches of all key players for the past 4 years.
- Evaluate the supply-demand gaps, import-export statistics and regulatory landscape for more than top 20 countries globally for the market.
1. Metal Deactivator Market - Overview
1.1. Definitions and Scope
2. Metal Deactivator Market - Executive summary
2.1. Market Revenue, Market Size and Key Trends by Company
2.2. Key Trends by type of Application
2.3. Key Trends segmented by Geography
3. Metal Deactivator Market
3.1. Comparative analysis
3.1.1. Product Benchmarking - Top 10 companies
3.1.2. Top 5 Financials Analysis
3.1.3. Market Value split by Top 10 companies
3.1.4. Patent Analysis - Top 10 companies
3.1.5. Pricing Analysis
4. Metal Deactivator Market – Startup companies Scenario Premium
4.1. Top 10 startup company Analysis by
4.1.1. Investment
4.1.2. Revenue
4.1.3. Market Shares
4.1.4. Market Size and Application Analysis
4.1.5. Venture Capital and Funding Scenario
5. Metal Deactivator Market – Industry Market Entry Scenario Premium
5.1. Regulatory Framework Overview
5.2. New Business and Ease of Doing business index
5.3. Case studies of successful ventures
5.4. Customer Analysis – Top 10 companies
6. Metal Deactivator Market Forces
6.1. Drivers
6.2. Constraints
6.3. Challenges
6.4. Porters five force model
6.4.1. Bargaining power of suppliers
6.4.2. Bargaining powers of customers
6.4.3. Threat of new entrants
6.4.4. Rivalry among existing players
6.4.5. Threat of substitutes
7. Metal Deactivator Market -Strategic analysis
7.1. Value chain analysis
7.2. Opportunities analysis
7.3. Product life cycle
7.4. Suppliers and distributors Market Share
8. Metal Deactivator Market – By Metals (Market Size -$Million / $Billion)
8.1. Market Size and Market Share Analysis
8.2. Application Revenue and Trend Research
8.3. Product Segment Analysis
8.3.1. Introduction
8.3.2. Copper
8.3.3. Aluminum
8.3.4. Alloys
8.3.5. Others
9. Metal Deactivator Market – By Formulation (Market Size -$Million / $Billion)
9.1. Introduction
9.2. Water Soluble MDA
9.3. Oil Soluble MDA
10. Metal Deactivator – By End Use Industry(Market Size -$Million / $Billion)
10.1. Segment type Size and Market Share Analysis
10.2. Application Revenue and Trends by type of Application
10.3. Application Segment Analysis by Type
10.3.1. Introduction
10.3.2. Industrial
10.3.2.1. Metal working fluid
10.3.2.2. HFC
10.3.2.3. HFA
10.3.2.4. Industrial machine lubrication
10.3.2.5. Others
10.3.3. Automotive
10.3.3.1. Engine Oils
10.3.3.2. Gear Oils
10.3.3.3. Compressor oils
10.3.3.4. Greases
10.3.3.5. Others
10.3.4. Aviation
10.3.4.1. Jet fuels
10.3.4.2. Aviation fuels
10.3.4.3. Others
10.3.5. Polymers (Wire & Cable, Plastics)
10.3.5.1. Building wire
10.3.5.2. Communication Cables
10.3.5.3. Power cables
10.3.5.4. Others
10.3.6. Food & Agriculture
10.3.6.1. Canned food
10.3.6.2. Preservatives
10.3.6.3. Others
11. Metal Deactivator - By Geography (Market Size -$Million / $Billion)
11.1. Metal Deactivator Market - North America Segment Research
11.2. North America Market Research (Million / $Billion)
11.2.1. Segment type Size and Market Size Analysis
11.2.2. Revenue and Trends
11.2.3. Application Revenue and Trends by type of Application
11.2.4. Company Revenue and Product Analysis
11.2.5. North America Product type and Application Market Size
11.2.5.1. U.S.
11.2.5.2. Canada
11.2.5.3. Mexico
11.2.5.4. Rest of North America
11.3. Metal Deactivator - South America Segment Research
11.4. South America Market Research (Market Size -$Million / $Billion)
11.4.1. Segment type Size and Market Size Analysis
11.4.2. Revenue and Trends
11.4.3. Application Revenue and Trends by type of Application
11.4.4. Company Revenue and Product Analysis
11.4.5. South America Product type and Application Market Size
11.4.5.1. Brazil
11.4.5.2. Venezuela
11.4.5.3. Argentina
11.4.5.4. Ecuador
11.4.5.5. Peru
11.4.5.6. Colombia
11.4.5.7. Costa Rica
11.4.5.8. Rest of South America
11.5. Metal Deactivator - Europe Segment Research
11.6. Europe Market Research (Market Size -$Million / $Billion)
11.6.1. Segment type Size and Market Size Analysis
11.6.2. Revenue and Trends
11.6.3. Application Revenue and Trends by type of Application
11.6.4. Company Revenue and Product Analysis
11.6.5. Europe Segment Product type and Application Market Size
11.6.5.1. U.K
11.6.5.2. Germany
11.6.5.3. Italy
11.6.5.4. France
11.6.5.5. Netherlands
11.6.5.6. Belgium
11.6.5.7. Spain
11.6.5.8. Denmark
11.6.5.9. Rest of Europe
11.7. Metal Deactivator – APAC Segment Research
11.8. APAC Market Research (Market Size -$Million / $Billion)
11.8.1. Segment type Size and Market Size Analysis
11.8.2. Revenue and Trends
11.8.3. Application Revenue and Trends by type of Application
11.8.4. Company Revenue and Product Analysis
11.8.5. APAC Segment – Product type and Application Market Size
11.8.5.1. China
11.8.5.2. Australia
11.8.5.3. Japan
11.8.5.4. South Korea
11.8.5.5. India
11.8.5.6. Taiwan
11.8.5.7. Malaysia
12. Metal Deactivator Market - Entropy
12.1. New product launches
12.2. M&A's, collaborations, JVs and partnerships
13. Metal Deactivator Market – Industry / Segment Competition landscape Premium
13.1. Market Share Analysis
13.1.1. Market Share by Country- Top companies
13.1.2. Market Share by Region- Top 10 companies
13.1.3. Market Share by type of Application – Top 10 companies
13.1.4. Market Share by type of Product / Product category- Top 10 companies
13.1.5. Market Share at global level- Top 10 companies
13.1.6. Best Practises for companies
14. Metal Deactivator Market – Key Company List by Country Premium
15. Metal Deactivator Market Company Analysis
15.1. Market Share, Company Revenue, Products, M&A, Developments
15.2. BASF SE (Germany)
15.3. Innospec Inc. (U.S.)
15.4. Clariant AG (Europe)
15.5. Vanderbilt Chemicals LLC (U.S.)
15.6. The Lubrizol Corporation
15.7. Adeka Corporation
15.8. Company 7
15.9. Company 8
15.10. Company 9
15.11. Company 10
15.12. Company 11
15.13. Company 12
15.15. Company 13
15.15. Company 15 and more
"*Financials would be provided on a best efforts basis for private companies"
16. Metal Deactivator Market -Appendix
16.1. Abbreviations
16.2. Sources
17. Metal Deactivator Market -Methodology Premium
17.1. Research Methodology
17.1.1. Company Expert Interviews
17.1.2. Industry Databases
17.1.3. Associations
17.1.4. Company News
17.1.5. Company Annual Reports
17.1.6. Application Trends
17.1.7. New Products and Product database
17.1.8. Company Transcripts
17.1.9. R&D Trends
17.1.10. Key Opinion Leaders Interviews
17.1.11. Supply and Demand Trends
List of Tables:
Table 1: Metal Deactivator Market Overview 2019-2024
Table 2: Metal Deactivator Market Leader Analysis 2018-2019 (US$)
Table 3: Metal Deactivator Market Product Analysis 2018-2019 (US$)
Table 4: Metal Deactivator Market End User Analysis 2018-2019 (US$)
Table 5: Metal Deactivator Market Patent Analysis 2013-2018* (US$)
Table 6: Metal Deactivator Market Financial Analysis 2018-2019 (US$)
Table 7: Metal Deactivator Market Driver Analysis 2018-2019 (US$)
Table 8: Metal Deactivator Market Challenges Analysis 2018-2019 (US$)
Table 9: Metal Deactivator Market Constraint Analysis 2018-2019 (US$)
Table 10: Metal Deactivator Market Supplier Bargaining Power Analysis 2018-2019 (US$)
Table 11: Metal Deactivator Market Buyer Bargaining Power Analysis 2018-2019 (US$)
Table 12: Metal Deactivator Market Threat of Substitutes Analysis 2018-2019 (US$)
Table 13: Metal Deactivator Market Threat of New Entrants Analysis 2018-2019 (US$)
Table 14: Metal Deactivator Market Degree of Competition Analysis 2018-2019 (US$)
Table 15: Metal Deactivator Market Value Chain Analysis 2018-2019 (US$)
Table 16: Metal Deactivator Market Pricing Analysis 2019-2024 (US$)
Table 17: Metal Deactivator Market Opportunities Analysis 2019-2024 (US$)
Table 18: Metal Deactivator Market Product Life Cycle Analysis 2019-2024 (US$)
Table 19: Metal Deactivator Market Supplier Analysis 2018-2019 (US$)
Table 20: Metal Deactivator Market Distributor Analysis 2018-2019 (US$)
Table 21: Metal Deactivator Market Trend Analysis 2018-2019 (US$)
Table 22: Metal Deactivator Market Size 2018 (US$)
Table 23: Metal Deactivator Market Forecast Analysis 2019-2024 (US$)
Table 24: Metal Deactivator Market Sales Forecast Analysis 2019-2024 (Units)
Table 25: Metal Deactivator Market, Revenue & Volume, Regulation Analysis, 2019-2024 ($)
Table 26: Metal Deactivator Market Regulation Analysis, Revenue & Volume, By Regulations worldwide, 2019-2024 ($)
Table 27: Metal Deactivator Market Regulation Analysis, Revenue & Volume, By Registration procedure - Europe, 2019-2024 ($)
Table 28: Metal Deactivator Market Regulation Analysis, Revenue & Volume, By Registration procedure - U. S, 2019-2024 ($)
Table 29: Metal Deactivator Market, Revenue & Volume, By Metals, 2019-2024 ($)
Table 30: Metal Deactivator Market By Metals, Revenue & Volume, By Copper, 2019-2024 ($)
Table 31: Metal Deactivator Market By Metals, Revenue & Volume, By Aluminum, 2019-2024 ($)
Table 32: Metal Deactivator Market By Metals, Revenue & Volume, By Alloys, 2019-2024 ($)
Table 33: Metal Deactivator Market, Revenue & Volume, By Formulation, 2019-2024 ($)
Table 34: Metal Deactivator Market By Formulation, Revenue & Volume, By Water Soluble MDA, 2019-2024 ($)
Table 35: Metal Deactivator Market By Formulation, Revenue & Volume, By Oil Soluble MDA, 2019-2024 ($)
Table 36: Metal Deactivator Market, Revenue & Volume, By End-User Industry, 2019-2024 ($)
Table 37: Metal Deactivator Market By End-User Industry, Revenue & Volume, By Industrial, 2019-2024 ($)
Table 38: Metal Deactivator Market By End-User Industry, Revenue & Volume, By Automotive, 2019-2024 ($)
Table 39: Metal Deactivator Market By End-User Industry, Revenue & Volume, By Aviation, 2019-2024 ($)
Table 40: Metal Deactivator Market By End-User Industry, Revenue & Volume, By Polymers (Wire & Cable, Plastics), 2019-2024 ($)
Table 41: Metal Deactivator Market By End-User Industry, Revenue & Volume, By Food & Agriculture, 2019-2024 ($)
Table 42: North America Metal Deactivator Market, Revenue & Volume, Regulation Analysis, 2019-2024 ($)
Table 43: North America Metal Deactivator Market, Revenue & Volume, By Metals, 2019-2024 ($)
Table 44: North America Metal Deactivator Market, Revenue & Volume, By Formulation, 2019-2024 ($)
Table 45: North America Metal Deactivator Market, Revenue & Volume, By End-User Industry, 2019-2024 ($)
Table 46: South america Metal Deactivator Market, Revenue & Volume, Regulation Analysis, 2019-2024 ($)
Table 47: South america Metal Deactivator Market, Revenue & Volume, By Metals, 2019-2024 ($)
Table 48: South america Metal Deactivator Market, Revenue & Volume, By Formulation, 2019-2024 ($)
Table 49: South america Metal Deactivator Market, Revenue & Volume, By End-User Industry, 2019-2024 ($)
Table 50: Europe Metal Deactivator Market, Revenue & Volume, Regulation Analysis, 2019-2024 ($)
Table 51: Europe Metal Deactivator Market, Revenue & Volume, By Metals, 2019-2024 ($)
Table 52: Europe Metal Deactivator Market, Revenue & Volume, By Formulation, 2019-2024 ($)
Table 53: Europe Metal Deactivator Market, Revenue & Volume, By End-User Industry, 2019-2024 ($)
Table 54: APAC Metal Deactivator Market, Revenue & Volume, Regulation Analysis, 2019-2024 ($)
Table 55: APAC Metal Deactivator Market, Revenue & Volume, By Metals, 2019-2024 ($)
Table 56: APAC Metal Deactivator Market, Revenue & Volume, By Formulation, 2019-2024 ($)
Table 57: APAC Metal Deactivator Market, Revenue & Volume, By End-User Industry, 2019-2024 ($)
Table 58: Middle East & Africa Metal Deactivator Market, Revenue & Volume, Regulation Analysis, 2019-2024 ($)
Table 59: Middle East & Africa Metal Deactivator Market, Revenue & Volume, By Metals, 2019-2024 ($)
Table 60: Middle East & Africa Metal Deactivator Market, Revenue & Volume, By Formulation, 2019-2024 ($)
Table 61: Middle East & Africa Metal Deactivator Market, Revenue & Volume, By End-User Industry, 2019-2024 ($)
Table 62: Russia Metal Deactivator Market, Revenue & Volume, Regulation Analysis, 2019-2024 ($)
Table 63: Russia Metal Deactivator Market, Revenue & Volume, By Metals, 2019-2024 ($)
Table 64: Russia Metal Deactivator Market, Revenue & Volume, By Formulation, 2019-2024 ($)
Table 65: Russia Metal Deactivator Market, Revenue & Volume, By End-User Industry, 2019-2024 ($)
Table 66: Israel Metal Deactivator Market, Revenue & Volume, Regulation Analysis, 2019-2024 ($)
Table 67: Israel Metal Deactivator Market, Revenue & Volume, By Metals, 2019-2024 ($)
Table 68: Israel Metal Deactivator Market, Revenue & Volume, By Formulation, 2019-2024 ($)
Table 69: Israel Metal Deactivator Market, Revenue & Volume, By End-User Industry, 2019-2024 ($)
Table 70: Top Companies 2018 (US$) Metal Deactivator Market, Revenue & Volume
Table 71: Product Launch 2018-2019 Metal Deactivator Market, Revenue & Volume
Table 72: Mergers & Acquistions 2018-2019 Metal Deactivator Market, Revenue & Volume
List of Figures:
Figure 1: Overview of Metal Deactivator Market 2019-2024
Figure 2: Market Share Analysis for Metal Deactivator Market 2018 (US$)
Figure 3: Product Comparison in Metal Deactivator Market 2018-2019 (US$)
Figure 4: End User Profile for Metal Deactivator Market 2018-2019 (US$)
Figure 5: Patent Application and Grant in Metal Deactivator Market 2013-2018* (US$)
Figure 6: Top 5 Companies Financial Analysis in Metal Deactivator Market 2018-2019 (US$)
Figure 7: Market Entry Strategy in Metal Deactivator Market 2018-2019
Figure 8: Ecosystem Analysis in Metal Deactivator Market 2018
Figure 9: Average Selling Price in Metal Deactivator Market 2019-2024
Figure 10: Top Opportunites in Metal Deactivator Market 2018-2019
Figure 11: Market Life Cycle Analysis in Metal Deactivator Market
Figure 12: GlobalRegulation Analysis Metal Deactivator Market Revenue, 2019-2024 ($)
Figure 13: GlobalBy Metals Metal Deactivator Market Revenue, 2019-2024 ($)
Figure 14: GlobalBy Formulation Metal Deactivator Market Revenue, 2019-2024 ($)
Figure 15: GlobalBy End-User Industry Metal Deactivator Market Revenue, 2019-2024 ($)
Figure 16: Global Metal Deactivator Market - By Geography
Figure 17: Global Metal Deactivator Market Value & Volume, By Geography, 2019-2024 ($)
Figure 18: Global Metal Deactivator Market CAGR, By Geography, 2019-2024 (%)
Figure 19: North America Metal Deactivator Market Value & Volume, 2019-2024 ($)
Figure 20: US Metal Deactivator Market Value & Volume, 2019-2024 ($)
Figure 21: US GDP and Population, 2018-2019 ($)
Figure 22: US GDP – Composition of 2018, By Sector of Origin
Figure 23: US Export and Import Value & Volume, 2018-2019 ($)
Figure 24: Canada Metal Deactivator Market Value & Volume, 2019-2024 ($)
Figure 25: Canada GDP and Population, 2018-2019 ($)
Figure 26: Canada GDP – Composition of 2018, By Sector of Origin
Figure 27: Canada Export and Import Value & Volume, 2018-2019 ($)
Figure 28: Mexico Metal Deactivator Market Value & Volume, 2019-2024 ($)
Figure 29: Mexico GDP and Population, 2018-2019 ($)
Figure 30: Mexico GDP – Composition of 2018, By Sector of Origin
Figure 31: Mexico Export and Import Value & Volume, 2018-2019 ($)
Figure 32: South America Metal Deactivator Market Value & Volume, 2019-2024 ($)
Figure 33: Brazil Metal Deactivator Market Value & Volume, 2019-2024 ($)
Figure 34: Brazil GDP and Population, 2018-2019 ($)
Figure 35: Brazil GDP – Composition of 2018, By Sector of Origin
Figure 36: Brazil Export and Import Value & Volume, 2018-2019 ($)
Figure 37: Venezuela Metal Deactivator Market Value & Volume, 2019-2024 ($)
Figure 38: Venezuela GDP and Population, 2018-2019 ($)
Figure 39: Venezuela GDP – Composition of 2018, By Sector of Origin
Figure 40: Venezuela Export and Import Value & Volume, 2018-2019 ($)
Figure 41: Argentina Metal Deactivator Market Value & Volume, 2019-2024 ($)
Figure 42: Argentina GDP and Population, 2018-2019 ($)
Figure 43: Argentina GDP – Composition of 2018, By Sector of Origin
Figure 44: Argentina Export and Import Value & Volume, 2018-2019 ($)
Figure 45: Ecuador Metal Deactivator Market Value & Volume, 2019-2024 ($)
Figure 46: Ecuador GDP and Population, 2018-2019 ($)
Figure 47: Ecuador GDP – Composition of 2018, By Sector of Origin
Figure 48: Ecuador Export and Import Value & Volume, 2018-2019 ($)
Figure 49: Peru Metal Deactivator Market Value & Volume, 2019-2024 ($)
Figure 50: Peru GDP and Population, 2018-2019 ($)
Figure 51: Peru GDP – Composition of 2018, By Sector of Origin
Figure 52: Peru Export and Import Value & Volume, 2018-2019 ($)
Figure 53: Colombia Metal Deactivator Market Value & Volume, 2019-2024 ($)
Figure 54: Colombia GDP and Population, 2018-2019 ($)
Figure 55: Colombia GDP – Composition of 2018, By Sector of Origin
Figure 56: Colombia Export and Import Value & Volume, 2018-2019 ($)
Figure 57: Costa Rica Metal Deactivator Market Value & Volume, 2019-2024 ($)
Figure 58: Costa Rica GDP and Population, 2018-2019 ($)
Figure 59: Costa Rica GDP – Composition of 2018, By Sector of Origin
Figure 60: Costa Rica Export and Import Value & Volume, 2018-2019 ($)
Figure 61: Europe Metal Deactivator Market Value & Volume, 2019-2024 ($)
Figure 62: U.K Metal Deactivator Market Value & Volume, 2019-2024 ($)
Figure 63: U.K GDP and Population, 2018-2019 ($)
Figure 64: U.K GDP – Composition of 2018, By Sector of Origin
Figure 65: U.K Export and Import Value & Volume, 2018-2019 ($)
Figure 66: Germany Metal Deactivator Market Value & Volume, 2019-2024 ($)
Figure 67: Germany GDP and Population, 2018-2019 ($)
Figure 68: Germany GDP – Composition of 2018, By Sector of Origin
Figure 69: Germany Export and Import Value & Volume, 2018-2019 ($)
Figure 70: Italy Metal Deactivator Market Value & Volume, 2019-2024 ($)
Figure 71: Italy GDP and Population, 2018-2019 ($)
Figure 72: Italy GDP – Composition of 2018, By Sector of Origin
Figure 73: Italy Export and Import Value & Volume, 2018-2019 ($)
Figure 74: France Metal Deactivator Market Value & Volume, 2019-2024 ($)
Figure 75: France GDP and Population, 2018-2019 ($)
Figure 76: France GDP – Composition of 2018, By Sector of Origin
Figure 77: France Export and Import Value & Volume, 2018-2019 ($)
Figure 78: Netherlands Metal Deactivator Market Value & Volume, 2019-2024 ($)
Figure 79: Netherlands GDP and Population, 2018-2019 ($)
Figure 80: Netherlands GDP – Composition of 2018, By Sector of Origin
Figure 81: Netherlands Export and Import Value & Volume, 2018-2019 ($)
Figure 82: Belgium Metal Deactivator Market Value & Volume, 2019-2024 ($)
Figure 83: Belgium GDP and Population, 2018-2019 ($)
Figure 84: Belgium GDP – Composition of 2018, By Sector of Origin
Figure 85: Belgium Export and Import Value & Volume, 2018-2019 ($)
Figure 86: Spain Metal Deactivator Market Value & Volume, 2019-2024 ($)
Figure 87: Spain GDP and Population, 2018-2019 ($)
Figure 88: Spain GDP – Composition of 2018, By Sector of Origin
Figure 89: Spain Export and Import Value & Volume, 2018-2019 ($)
Figure 90: Denmark Metal Deactivator Market Value & Volume, 2019-2024 ($)
Figure 91: Denmark GDP and Population, 2018-2019 ($)
Figure 92: Denmark GDP – Composition of 2018, By Sector of Origin
Figure 93: Denmark Export and Import Value & Volume, 2018-2019 ($)
Figure 94: APAC Metal Deactivator Market Value & Volume, 2019-2024 ($)
Figure 95: China Metal Deactivator Market Value & Volume, 2019-2024
Figure 96: China GDP and Population, 2018-2019 ($)
Figure 97: China GDP – Composition of 2018, By Sector of Origin
Figure 98: China Export and Import Value & Volume, 2018-2019 ($) Metal Deactivator Market China Export and Import Value & Volume, 2018-2019 ($)
Figure 99: Australia Metal Deactivator Market Value & Volume, 2019-2024 ($)
Figure 100: Australia GDP and Population, 2018-2019 ($)
Figure 101: Australia GDP – Composition of 2018, By Sector of Origin
Figure 102: Australia Export and Import Value & Volume, 2018-2019 ($)
Figure 103: South Korea Metal Deactivator Market Value & Volume, 2019-2024 ($)
Figure 104: South Korea GDP and Population, 2018-2019 ($)
Figure 105: South Korea GDP – Composition of 2018, By Sector of Origin
Figure 106: South Korea Export and Import Value & Volume, 2018-2019 ($)
Figure 107: India Metal Deactivator Market Value & Volume, 2019-2024 ($)
Figure 108: India GDP and Population, 2018-2019 ($)
Figure 109: India GDP – Composition of 2018, By Sector of Origin
Figure 110: India Export and Import Value & Volume, 2018-2019 ($)
Figure 111: Taiwan Metal Deactivator Market Value & Volume, 2019-2024 ($)
Figure 112: Taiwan GDP and Population, 2018-2019 ($)
Figure 113: Taiwan GDP – Composition of 2018, By Sector of Origin
Figure 114: Taiwan Export and Import Value & Volume, 2018-2019 ($)
Figure 115: Malaysia Metal Deactivator Market Value & Volume, 2019-2024 ($)
Figure 116: Malaysia GDP and Population, 2018-2019 ($)
Figure 117: Malaysia GDP – Composition of 2018, By Sector of Origin
Figure 118: Malaysia Export and Import Value & Volume, 2018-2019 ($)
Figure 119: Hong Kong Metal Deactivator Market Value & Volume, 2019-2024 ($)
Figure 120: Hong Kong GDP and Population, 2018-2019 ($)
Figure 121: Hong Kong GDP – Composition of 2018, By Sector of Origin
Figure 122: Hong Kong Export and Import Value & Volume, 2018-2019 ($)
Figure 123: Middle East & Africa Metal Deactivator Market Middle East & Africa 3D Printing Market Value & Volume, 2019-2024 ($)
Figure 124: Russia Metal Deactivator Market Value & Volume, 2019-2024 ($)
Figure 125: Russia GDP and Population, 2018-2019 ($)
Figure 126: Russia GDP – Composition of 2018, By Sector of Origin
Figure 127: Russia Export and Import Value & Volume, 2018-2019 ($)
Figure 128: Israel Metal Deactivator Market Value & Volume, 2019-2024 ($)
Figure 129: Israel GDP and Population, 2018-2019 ($)
Figure 130: Israel GDP – Composition of 2018, By Sector of Origin
Figure 131: Israel Export and Import Value & Volume, 2018-2019 ($)
Figure 132: Entropy Share, By Strategies, 2018-2019* (%) Metal Deactivator Market
Figure 133: Developments, 2018-2019* Metal Deactivator Market
Figure 134: Company 1 Metal Deactivator Market Net Revenue, By Years, 2018-2019* ($)
Figure 135: Company 1 Metal Deactivator Market Net Revenue Share, By Business segments, 2018 (%)
Figure 136: Company 1 Metal Deactivator Market Net Sales Share, By Geography, 2018 (%)
Figure 137: Company 2 Metal Deactivator Market Net Revenue, By Years, 2018-2019* ($)
Figure 138: Company 2 Metal Deactivator Market Net Revenue Share, By Business segments, 2018 (%)
Figure 139: Company 2 Metal Deactivator Market Net Sales Share, By Geography, 2018 (%)
Figure 140: Company 3 Metal Deactivator Market Net Revenue, By Years, 2018-2019* ($)
Figure 141: Company 3 Metal Deactivator Market Net Revenue Share, By Business segments, 2018 (%)
Figure 142: Company 3 Metal Deactivator Market Net Sales Share, By Geography, 2018 (%)
Figure 143: Company 4 Metal Deactivator Market Net Revenue, By Years, 2018-2019* ($)
Figure 144: Company 4 Metal Deactivator Market Net Revenue Share, By Business segments, 2018 (%)
Figure 145: Company 4 Metal Deactivator Market Net Sales Share, By Geography, 2018 (%)
Figure 146: Company 5 Metal Deactivator Market Net Revenue, By Years, 2018-2019* ($)
Figure 147: Company 5 Metal Deactivator Market Net Revenue Share, By Business segments, 2018 (%)
Figure 148: Company 5 Metal Deactivator Market Net Sales Share, By Geography, 2018 (%)
Figure 149: Company 6 Metal Deactivator Market Net Revenue, By Years, 2018-2019* ($)
Figure 150: Company 6 Metal Deactivator Market Net Revenue Share, By Business segments, 2018 (%)
Figure 151: Company 6 Metal Deactivator Market Net Sales Share, By Geography, 2018 (%)
Figure 152: Company 7 Metal Deactivator Market Net Revenue, By Years, 2018-2019* ($)
Figure 153: Company 7 Metal Deactivator Market Net Revenue Share, By Business segments, 2018 (%)
Figure 154: Company 7 Metal Deactivator Market Net Sales Share, By Geography, 2018 (%)
Figure 155: Company 8 Metal Deactivator Market Net Revenue, By Years, 2018-2019* ($)
Figure 156: Company 8 Metal Deactivator Market Net Revenue Share, By Business segments, 2018 (%)
Figure 157: Company 8 Metal Deactivator Market Net Sales Share, By Geography, 2018 (%)
Figure 158: Company 9 Metal Deactivator Market Net Revenue, By Years, 2018-2019* ($)
Figure 159: Company 9 Metal Deactivator Market Net Revenue Share, By Business segments, 2018 (%)
Figure 160: Company 9 Metal Deactivator Market Net Sales Share, By Geography, 2018 (%)
Figure 161: Company 10 Metal Deactivator Market Net Revenue, By Years, 2018-2019* ($)
Figure 162: Company 10 Metal Deactivator Market Net Revenue Share, By Business segments, 2018 (%)
Figure 163: Company 10 Metal Deactivator Market Net Sales Share, By Geography, 2018 (%)
Figure 164: Company 11 Metal Deactivator Market Net Revenue, By Years, 2018-2019* ($)
Figure 165: Company 11 Metal Deactivator Market Net Revenue Share, By Business segments, 2018 (%)
Figure 166: Company 11 Metal Deactivator Market Net Sales Share, By Geography, 2018 (%)
Figure 167: Company 12 Metal Deactivator Market Net Revenue, By Years, 2018-2019* ($)
Figure 168: Company 12 Metal Deactivator Market Net Revenue Share, By Business segments, 2018 (%)
Figure 169: Company 12 Metal Deactivator Market Net Sales Share, By Geography, 2018 (%)
Figure 170: Company 13 Metal Deactivator Market Net Revenue, By Years, 2018-2019* ($)
Figure 171: Company 13 Metal Deactivator Market Net Revenue Share, By Business segments, 2018 (%)
Figure 172: Company 13 Metal Deactivator Market Net Sales Share, By Geography, 2018 (%)
Figure 173: Company 14 Metal Deactivator Market Net Revenue, By Years, 2018-2019* ($)
Figure 174: Company 14 Metal Deactivator Market Net Revenue Share, By Business segments, 2018 (%)
Figure 175: Company 14 Metal Deactivator Market Net Sales Share, By Geography, 2018 (%)
Figure 176: Company 15 Metal Deactivator Market Net Revenue, By Years, 2018-2019* ($)
Figure 177: Company 15 Metal Deactivator Market Net Revenue Share, By Business segments, 2018 (%)
Figure 178: Company 15 Metal Deactivator Market Net Sales Share, By Geography, 2018 (%)