 이메일
이메일 인쇄
인쇄


Unmanned Underwater Vehicles (UUV) Market - Forecast(2026 - 2031)
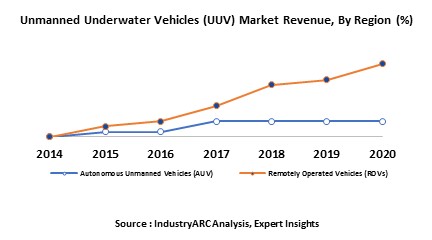
There are two types of unmanned underwater vehicles which are Autonomous Underwater Vehicles and Remotely Operated Vehicles. The main difference is that AUV does not require continuous human interference or control and operates according to the pre-programmed instructions while the ROV is controlled continuously via an umbilical cord. Unmanned underwater vehicles (UUVs) are primarily used in defense and government operations, academic and scientific research, commercial activity and retrieval systems.
Offshore oil and gas industry heavily depends on the vessels and container facilities provided by UUVs in deep waters for various exploration and upstream processes. Commercial Exploration in the ocean depths for oil, gas and minerals is a relatively recent activity. Since deep and ultra-deep oceans still remain to be an unexplored part of the planet, tremendous increase in the underwater activity can be foreseen in the near future.
The market size in 2017 was estimated to be $2.7 bn and it is expected to reach $4.7 bn by the year 2023. The CAGR for the unmanned underwater vehicles market for the period 2017- 2020 is estimated to be around 13%.
What are Unmanned Underwater Vehicles (UUV)?
UUV is a robot vehicle that can operate underwater without occupancy of human being. Unmanned underwater vehicles (UUV) are thus self-propelled vehicles. It is commonly used in industries and in military operations. These vehicles are designed to operate for periods ranging from a few hours to several days .The vehicles are equipped with the instruments and sensors whichever are required for the specific task they may be sonar, camera, explosive devices, chemical injector and various others. They are preferred for subsea applications because they are continuously assisted by high end computer systems and offer safe option for activities and exploration underwater.
What are the major applications for Unmanned Underwater Vehicles (UUV)?
UUVs have gained popularity with the growing technical features and the continuously evolving specialized mounting equipment. The applications include surveillance, reconnaissance, mine countermeasures, ocean floor mapping, pipeline inspection, polar ice research, anti-submarine warfare and so on. The subsea explorers and extraction companies are the major users for the equipment along with military and naval forces. It assists in the subsea activities which otherwise are to be performed by human themselves. Hence they help in maintaining secure method for underwater functions of various companies which have to deal with them.
Market Research and Market Trends of Unmanned Underwater Vehicles (UUV) Ecosystem
- To improve the ability of unmanned systems to communicate and operate between air, surface, and undersea domains is one important area of focus beyond developing larger UUVs. In a manner similar to manned ships and helicopters currently collaborating to locate and destroy sea mines, unmanned surface and undersea vehicles could be used to accomplish the same mission while keeping human operators at safe end. AeroVironment successfully achieved communication of its Blackwing UAV with a swarm of unmanned undersea vehicles recently and parallel to it Lockheed Martin also launched a UAV from a Marlin MK2 autonomous underwater vehicle successfully.
- The Navy and other DoD departments have allocated considerably more funds for the next generation UUV systems and technologies research. Defense funding for research into UUVs is around three times more than funds for procurement. The Large Displacement Unmanned Undersea Vehicle (LDUUV) and the Extra Large UUV (XLUUV) are the largest portions of these research programs.
- Hydronalix recently received a contract for an advanced research to for development of prototype mobile gateway buoys with integrated communications and control software from the Naval Air Warfare Center Aircraft Division. Hydronalix engineers are building an improved gateway buoy hull with hybrid electric and heavy-fuel propulsion, which integrates MK 18 gateway buoy communications equipment, and controlled by Neptune control software. The company will build two gateway buoy prototypes, and integrate them with control software and acoustic communication systems.
- Ability of USVs and UUVs systems to adapt intelligently to changes in their tactical situations is another important feature which is of prime importance. Improvements in the autonomous capabilities of these systems are crucial to their future development. There are changes expected in the tactical situations as the specific missions of these vehicles evolve and their onboard sensing systems will also continuously evolve indicating such changes. The onboard systems must be capable of recognizing the changes and adapting the mission plan accordingly, without the need for intervention by operators. Hence AI and ML concepts are being considered for OBEs.
Who are the Major Players in Unmanned Underwater Vehicles (UUV) market?
The players profiled in the report include SAAB Seaeye, Oceaneering International Inc., Subsea7, Deep Ocean Engineering, FMC Schilling Robotics LLC, Bluefin Corp, Atlas Elektronik , BAE Systems, BaltRobotics Sp.z.o.o., Boston Engineering Corporation
What is our report scope?
The report incorporates in-depth assessment of the competitive landscape, product market sizing, product benchmarking, market trends, product developments, financial analysis, strategic analysis and so on to gauge the impact forces and potential opportunities of the market. Apart from this the report also includes a study of major developments in the market such as product launches, agreements, acquisitions, collaborations, mergers and so on to comprehend the prevailing market dynamics at present and its impact during the forecast period 2018-2024.
All our reports are customizable to your company needs to a certain extent, we do provide 20 free consulting hours along with purchase of each report, and this will allow you to request any additional data to customize the report to your needs.
Key Takeaways from this Report
- Evaluate market potential through analyzing growth rates (CAGR %), Volume (Units) and Value ($M) data given at country level – for product types, end use applications and by different industry verticals.
- Understand the different dynamics influencing the market – key driving factors, challenges and hidden opportunities.
- Get in-depth insights on your competitor performance – market shares, strategies, financial benchmarking, product benchmarking, SWOT and more.
- Analyze the sales and distribution channels across key geographies to improve top-line revenues.
- Understand the industry supply chain with a deep-dive on the value augmentation at each step, in order to optimize value and bring efficiencies in your processes.
- Get a quick outlook on the market entropy – M&A’s, deals, partnerships, product launches of all key players for the past 4 years.
- Evaluate the supply-demand gaps, import-export statistics and regulatory landscape for more than top 20 countries globally for the market.
1. Unmanned Underwater Vehicles (UUV)- Market Overview
2. Executive Summary
3. Unmanned Underwater Vehicles (UUV) - Market Landscape
3.1. Market Share Analysis
3.2. Comparative Analysis
3.2.1. Product Benchmarking
3.2.2. End User Profiling
3.2.3. Top 5 Financials Analysis
4. Unmanned Underwater Vehicles (UUV)- Market Forces
4.1. Market Drivers
4.2. Market Constraints
4.3. Market Challenges
4.4. Attractiveness of the Unmanned Underwater Vehicles (UUV) market
4.4.1. Power of Suppliers
4.4.2. Power of Customers
4.4.3. Threat of New Entrants
4.4.4. Threat of Substitution
4.4.5. Degree of Competition
5. Unmanned Underwater Vehicles (UUV) market- Strategic Analysis
5.1. Value Chain Analysis
5.2. Pricing Analysis
5.3. Opportunities Analysis
5.4. Product/Market Life Cycle Analysis
5.5. Suppliers and Distributors
6. Unmanned Underwater Vehicles Market- By Type
6.1. Autonomous Unmanned Vehicles (AUV)
6.2. Remotely Operated Vehicles (ROV)
6.2.1. Observation/Inspection Class (OCROV)
6.2.2. Light Work Class
6.2.3. Work Class (WCROV)
6.2.4. Special Use Vehicles
6.3. 7.3. Hybrid Vehicles
7. Unmanned Underwater Vehicles Market- By Operating Depth
7.1. Less than 200m
7.2. 200-1000m
7.3. 1000-3000m
7.4. More than 3000m
8. Unmanned Underwater Vehicles Market- By Size Range(Diameter- inches)
8.1. Man-Portable( 3-9)
8.2. LWV (9- 12.75)
8.3. HWV(12.75-21)
8.4. Large(>36)
9. Global Unmanned Underwater Vehicles Market- By Application
9.1. Defence and Government
9.1.1. Intelligence, surveillance and reconnaissance
9.1.2. Mine countermeasures
9.1.3. Object detection and identification
9.1.4. Submarines/HOV Rescue
9.1.5. Harbour/Port Security
9.1.6. Navigation and Accident investigation
9.1.7. Nuclear Facilities and Dam Inspection
9.2. 6.2. Academic and Scientific Research
9.2.1. Scientific Research
9.2.1.1. Marine Geology
9.2.1.2. Geophysics and Oceanographic Studies
9.2.1.3. Ocean observation system support
9.2.1.4. Bio prospecting and pharmaceutical research
9.2.2. Academic Research
9.2.2.1. Ecological Monitoring,
9.2.2.2. Bathymetry mapping
9.2.2.3. Habitat Mapping and Classification
9.2.2.4. Aquaculture-Mariculture
9.3. Commercial Exploration
9.3.1. Offshore Oil and Gas,
9.3.1.1. Shallow (Shelf) water Subsea oil fields
9.3.1.2. Deep water Subsea Oil fields
9.3.2. Underwater Seabed Mining
9.3.3. Renewable energy harnessing
9.3.4. Documentation , Adventure, Hobby and Tourism
9.4. Retrieval and Delivery Systems
9.4.1. Marine Archaeology
9.4.2. Marine Salvage and Debris removal
9.4.3. Forensic, Military and Scientific Search &Retrieval
10. Global Unmanned Underwater Vehicles (UUV) Market - By Geography
10.1. North America
10.1.1. U.S.
10.1.2. Canada
10.1.3. Mexico
10.2. South America
10.2.1. Brazil
10.2.2. Venezuela
10.2.3. Argentina
10.2.4. Ecuador
10.2.5. Peru
10.2.6. Colombia
10.2.7. Costa Rica
10.3. Europe
10.3.1. U.K
10.3.2. Germany
10.3.3. Italy
10.3.4. France
10.3.5. Netherlands
10.3.6. Belgium
10.3.7. Spain
10.3.8. Denmark
10.4. APAC
10.4.1. China
10.4.2. Australia
10.4.3. South Korea
10.4.4. India
10.4.5. Taiwan
10.4.6. Malaysia
10.4.7. Hong Kong
10.5. Middle East& Africa
10.6. Russia
10.7. Israel
10.8. Other
11. Market Entropy
11.1. New Product Launches
11.2. M&As, Collaborations, JVs, Partnership
12. Company Profiles (Overview, Financials, SWOT Analysis, Developments, Product Portfolio)
12.1. SAAB Seaeye
12.2. Oceaneering International Inc.
12.3. Subsea7
12.4. Deep Ocean Engineering
12.5. FMC Schilling Robotics LLC
12.6. Bluefin Corp
12.7. Atlas Elektronik
12.8. BAE Systems
12.9. BaltRobotics Sp.z.o.o.
12.10. Boston Engineering Corporation
*More than 10 Companies are profiled in this Research Report*
"*Financials would be provided on a best efforts basis for private companies"
13. Appendix
13.1. Abbreviations
13.2. Sources
13.3. Research Methodology
13.4. Bibliography
13.5. Compilation of Expert Insights
13.6. Disclaimer
List of Tables
Table1 Unmanned Underwater Vehicles (UUV) Market Overview 2019-2024
Table2 Unmanned Underwater Vehicles (UUV) Market Leader Analysis 2018-2019 (US$)
Table3 Unmanned Underwater Vehicles (UUV) MarketProduct Analysis 2018-2019 (US$)
Table4 Unmanned Underwater Vehicles (UUV) MarketEnd User Analysis 2018-2019 (US$)
Table5 Unmanned Underwater Vehicles (UUV) MarketPatent Analysis 2013-2018* (US$)
Table6 Unmanned Underwater Vehicles (UUV) MarketFinancial Analysis 2018-2019 (US$)
Table7 Unmanned Underwater Vehicles (UUV) Market Driver Analysis 2018-2019 (US$)
Table8 Unmanned Underwater Vehicles (UUV) MarketChallenges Analysis 2018-2019 (US$)
Table9 Unmanned Underwater Vehicles (UUV) MarketConstraint Analysis 2018-2019 (US$)
Table10 Unmanned Underwater Vehicles (UUV) Market Supplier Bargaining Power Analysis 2018-2019 (US$)
Table11 Unmanned Underwater Vehicles (UUV) Market Buyer Bargaining Power Analysis 2018-2019 (US$)
Table12 Unmanned Underwater Vehicles (UUV) Market Threat of Substitutes Analysis 2018-2019 (US$)
Table13 Unmanned Underwater Vehicles (UUV) Market Threat of New Entrants Analysis 2018-2019 (US$)
Table14 Unmanned Underwater Vehicles (UUV) Market Degree of Competition Analysis 2018-2019 (US$)
Table15 Unmanned Underwater Vehicles (UUV) MarketValue Chain Analysis 2018-2019 (US$)
Table16 Unmanned Underwater Vehicles (UUV) MarketPricing Analysis 2019-2024 (US$)
Table17 Unmanned Underwater Vehicles (UUV) MarketOpportunities Analysis 2019-2024 (US$)
Table18 Unmanned Underwater Vehicles (UUV) MarketProduct Life Cycle Analysis 2019-2024 (US$)
Table19 Unmanned Underwater Vehicles (UUV) MarketSupplier Analysis 2018-2019 (US$)
Table20 Unmanned Underwater Vehicles (UUV) MarketDistributor Analysis 2018-2019 (US$)
Table21 Unmanned Underwater Vehicles (UUV) Market Trend Analysis 2018-2019 (US$)
Table22 Unmanned Underwater Vehicles (UUV) Market Size 2018 (US$)
Table23 Unmanned Underwater Vehicles (UUV) Market Forecast Analysis 2019-2024 (US$)
Table24 Unmanned Underwater Vehicles (UUV) Market Sales Forecast Analysis 2019-2024 (Units)
Table25 Unmanned Underwater Vehicles (UUV) Market, Revenue & Volume,By Type, 2019-2024 ($)
Table26 Unmanned Underwater Vehicles (UUV) MarketBy Type, Revenue & Volume,By Autonomous Unmanned Vehicles (AUV), 2019-2024 ($)
Table27 Unmanned Underwater Vehicles (UUV) MarketBy Type, Revenue & Volume,By Remotely Operated Vehicles (ROV), 2019-2024 ($)
Table28 Unmanned Underwater Vehicles (UUV) MarketBy Type, Revenue & Volume,By Hybrid Vehicles, 2019-2024 ($)
Table29 Unmanned Underwater Vehicles (UUV) Market, Revenue & Volume,By Application, 2019-2024 ($)
Table30 Unmanned Underwater Vehicles (UUV) MarketBy Application, Revenue & Volume,By Defence and Government, 2019-2024 ($)
Table31 Unmanned Underwater Vehicles (UUV) MarketBy Application, Revenue & Volume,By Academic and Scientific Research, 2019-2024 ($)
Table32 Unmanned Underwater Vehicles (UUV) MarketBy Application, Revenue & Volume,By Commercial Exploration, 2019-2024 ($)
Table33 Unmanned Underwater Vehicles (UUV) MarketBy Application, Revenue & Volume,By Retrieval and Delivery Systems, 2019-2024 ($)
Table34 North America Unmanned Underwater Vehicles (UUV) Market, Revenue & Volume,By Type, 2019-2024 ($)
Table35 North America Unmanned Underwater Vehicles (UUV) Market, Revenue & Volume,By Product, 2019-2024 ($)
Table36 North America Unmanned Underwater Vehicles (UUV) Market, Revenue & Volume,By Technology, 2019-2024 ($)
Table37 North America Unmanned Underwater Vehicles (UUV) Market, Revenue & Volume,By Application, 2019-2024 ($)
Table38 North America Unmanned Underwater Vehicles (UUV) Market, Revenue & Volume,By End Use, 2019-2024 ($)
Table39 South america Unmanned Underwater Vehicles (UUV) Market, Revenue & Volume,By Type, 2019-2024 ($)
Table40 South america Unmanned Underwater Vehicles (UUV) Market, Revenue & Volume,By Product, 2019-2024 ($)
Table41 South america Unmanned Underwater Vehicles (UUV) Market, Revenue & Volume,By Technology, 2019-2024 ($)
Table42 South america Unmanned Underwater Vehicles (UUV) Market, Revenue & Volume,By Application, 2019-2024 ($)
Table43 South america Unmanned Underwater Vehicles (UUV) Market, Revenue & Volume,By End Use, 2019-2024 ($)
Table44 Europe Unmanned Underwater Vehicles (UUV) Market, Revenue & Volume,By Type, 2019-2024 ($)
Table45 Europe Unmanned Underwater Vehicles (UUV) Market, Revenue & Volume,By Product, 2019-2024 ($)
Table46 Europe Unmanned Underwater Vehicles (UUV) Market, Revenue & Volume,By Technology, 2019-2024 ($)
Table47 Europe Unmanned Underwater Vehicles (UUV) Market, Revenue & Volume,By Application, 2019-2024 ($)
Table48 Europe Unmanned Underwater Vehicles (UUV) Market, Revenue & Volume,By End Use, 2019-2024 ($)
Table49 APAC Unmanned Underwater Vehicles (UUV) Market, Revenue & Volume,By Type, 2019-2024 ($)
Table50 APAC Unmanned Underwater Vehicles (UUV) Market, Revenue & Volume,By Product, 2019-2024 ($)
Table51 APAC Unmanned Underwater Vehicles (UUV) Market, Revenue & Volume,By Technology, 2019-2024 ($)
Table52 APAC Unmanned Underwater Vehicles (UUV) Market, Revenue & Volume,By Application, 2019-2024 ($)
Table53 APAC Unmanned Underwater Vehicles (UUV) Market, Revenue & Volume,By End Use, 2019-2024 ($)
Table54 Middle East & Africa Unmanned Underwater Vehicles (UUV) Market, Revenue & Volume,By Type, 2019-2024 ($)
Table55 Middle East & Africa Unmanned Underwater Vehicles (UUV) Market, Revenue & Volume,By Product, 2019-2024 ($)
Table56 Middle East & Africa Unmanned Underwater Vehicles (UUV) Market, Revenue & Volume,By Technology, 2019-2024 ($)
Table57 Middle East & Africa Unmanned Underwater Vehicles (UUV) Market , Revenue & Volume,By Application, 2019-2024 ($)
Table58 Middle East & Africa Unmanned Underwater Vehicles (UUV) Market, Revenue & Volume,By End Use, 2019-2024 ($)
Table59 Russia Unmanned Underwater Vehicles (UUV) Market, Revenue & Volume,By Type, 2019-2024 ($)
Table60 Russia Unmanned Underwater Vehicles (UUV) Market, Revenue & Volume,By Product, 2019-2024 ($)
Table61 Russia Unmanned Underwater Vehicles (UUV) Market, Revenue & Volume,By Technology, 2019-2024 ($)
Table62 Russia Unmanned Underwater Vehicles (UUV) Market, Revenue & Volume,By Application, 2019-2024 ($)
Table63 Russia Unmanned Underwater Vehicles (UUV) Market, Revenue & Volume,By End Use, 2019-2024 ($)
Table64 Israel Unmanned Underwater Vehicles (UUV) Market, Revenue & Volume,By Type, 2019-2024 ($)
Table65 Israel Unmanned Underwater Vehicles (UUV) Market, Revenue & Volume,By Product, 2019-2024 ($)
Table66 Israel Unmanned Underwater Vehicles (UUV) Market, Revenue & Volume,By Technology, 2019-2024 ($)
Table67 Israel Unmanned Underwater Vehicles (UUV) Market, Revenue & Volume,By Application, 2019-2024 ($)
Table68 Israel Unmanned Underwater Vehicles (UUV) Market, Revenue & Volume,By End Use, 2019-2024 ($)
Table69 Top Companies 2018 (US$)Unmanned Underwater Vehicles (UUV) Market, Revenue & Volume,,
Table70 Product Launch 2018-2019Unmanned Underwater Vehicles (UUV) Market, Revenue & Volume,,
Table71 Mergers & Acquistions 2018-2019Unmanned Underwater Vehicles (UUV) Market, Revenue & Volume,,
List of Figures
Figure 1 Overview of Unmanned Underwater Vehicles (UUV) Market 2019-2024
Figure 2 Market Share Analysis for Unmanned Underwater Vehicles (UUV) Market 2018 (US$)
Figure 3 Product Comparison in Unmanned Underwater Vehicles (UUV) Market 2018-2019 (US$)
Figure 4 End User Profile for Unmanned Underwater Vehicles (UUV) Market 2018-2019 (US$)
Figure 5 Patent Application and Grant in Unmanned Underwater Vehicles (UUV) Market 2013-2018* (US$)
Figure 6 Top 5 Companies Financial Analysis in Unmanned Underwater Vehicles (UUV) Market 2018-2019 (US$)
Figure 7 Market Entry Strategy in Unmanned Underwater Vehicles (UUV) Market 2018-2019
Figure 8 Ecosystem Analysis in Unmanned Underwater Vehicles (UUV) Market2018
Figure 9 Average Selling Price in Unmanned Underwater Vehicles (UUV) Market 2019-2024
Figure 10 Top Opportunites in Unmanned Underwater Vehicles (UUV) Market 2018-2019
Figure 11 Market Life Cycle Analysis in Unmanned Underwater Vehicles (UUV) Market
Figure 12 GlobalBy TypeUnmanned Underwater Vehicles (UUV) Market Revenue, 2019-2024 ($)
Figure 13 GlobalBy ApplicationUnmanned Underwater Vehicles (UUV) Market Revenue, 2019-2024 ($)
Figure 14 Global Unmanned Underwater Vehicles (UUV) Market - By Geography
Figure 15 Global Unmanned Underwater Vehicles (UUV) Market Value & Volume, By Geography, 2019-2024 ($)
Figure 16 Global Unmanned Underwater Vehicles (UUV) Market CAGR, By Geography, 2019-2024 (%)
Figure 17 North America Unmanned Underwater Vehicles (UUV) Market Value & Volume, 2019-2024 ($)
Figure 18 US Unmanned Underwater Vehicles (UUV) Market Value & Volume, 2019-2024 ($)
Figure 19 US GDP and Population, 2018-2019 ($)
Figure 20 US GDP – Composition of 2018, By Sector of Origin
Figure 21 US Export and Import Value & Volume, 2018-2019 ($)
Figure 22 Canada Unmanned Underwater Vehicles (UUV) Market Value & Volume, 2019-2024 ($)
Figure 23 Canada GDP and Population, 2018-2019 ($)
Figure 24 Canada GDP – Composition of 2018, By Sector of Origin
Figure 25 Canada Export and Import Value & Volume, 2018-2019 ($)
Figure 26 Mexico Unmanned Underwater Vehicles (UUV) Market Value & Volume, 2019-2024 ($)
Figure 27 Mexico GDP and Population, 2018-2019 ($)
Figure 28 Mexico GDP – Composition of 2018, By Sector of Origin
Figure 29 Mexico Export and Import Value & Volume, 2018-2019 ($)
Figure 30 South America Unmanned Underwater Vehicles (UUV) MarketSouth America 3D Printing Market Value & Volume, 2019-2024 ($)
Figure 31 Brazil Unmanned Underwater Vehicles (UUV) Market Value & Volume, 2019-2024 ($)
Figure 32 Brazil GDP and Population, 2018-2019 ($)
Figure 33 Brazil GDP – Composition of 2018, By Sector of Origin
Figure 34 Brazil Export and Import Value & Volume, 2018-2019 ($)
Figure 35 Venezuela Unmanned Underwater Vehicles (UUV) Market Value & Volume, 2019-2024 ($)
Figure 36 Venezuela GDP and Population, 2018-2019 ($)
Figure 37 Venezuela GDP – Composition of 2018, By Sector of Origin
Figure 38 Venezuela Export and Import Value & Volume, 2018-2019 ($)
Figure 39 Argentina Unmanned Underwater Vehicles (UUV) Market Value & Volume, 2019-2024 ($)
Figure 40 Argentina GDP and Population, 2018-2019 ($)
Figure 41 Argentina GDP – Composition of 2018, By Sector of Origin
Figure 42 Argentina Export and Import Value & Volume, 2018-2019 ($)
Figure 43 Ecuador Unmanned Underwater Vehicles (UUV) Market Value & Volume, 2019-2024 ($)
Figure 44 Ecuador GDP and Population, 2018-2019 ($)
Figure 45 Ecuador GDP – Composition of 2018, By Sector of Origin
Figure 46 Ecuador Export and Import Value & Volume, 2018-2019 ($)
Figure 47 Peru Unmanned Underwater Vehicles (UUV) Market Value & Volume, 2019-2024 ($)
Figure 48 Peru GDP and Population, 2018-2019 ($)
Figure 49 Peru GDP – Composition of 2018, By Sector of Origin
Figure 50 Peru Export and Import Value & Volume, 2018-2019 ($)
Figure 51 Colombia Unmanned Underwater Vehicles (UUV) Market Value & Volume, 2019-2024 ($)
Figure 52 Colombia GDP and Population, 2018-2019 ($)
Figure 53 Colombia GDP – Composition of 2018, By Sector of Origin
Figure 54 Colombia Export and Import Value & Volume, 2018-2019 ($)
Figure 55 Costa Rica Unmanned Underwater Vehicles (UUV) MarketCosta Rica 3D Printing Market Value & Volume, 2019-2024 ($)
Figure 56 Costa Rica GDP and Population, 2018-2019 ($)
Figure 57 Costa Rica GDP – Composition of 2018, By Sector of Origin
Figure 58 Costa Rica Export and Import Value & Volume, 2018-2019 ($)
Figure 59 Europe Unmanned Underwater Vehicles (UUV) Market Value & Volume, 2019-2024 ($)
Figure 60 U.K Unmanned Underwater Vehicles (UUV) Market Value & Volume, 2019-2024 ($)
Figure 61 U.K GDP and Population, 2018-2019 ($)
Figure 62 U.K GDP – Composition of 2018, By Sector of Origin
Figure 63 U.K Export and Import Value & Volume, 2018-2019 ($)
Figure 64 Germany Unmanned Underwater Vehicles (UUV) Market Value & Volume, 2019-2024 ($)
Figure 65 Germany GDP and Population, 2018-2019 ($)
Figure 66 Germany GDP – Composition of 2018, By Sector of Origin
Figure 67 Germany Export and Import Value & Volume, 2018-2019 ($)
Figure 68 Italy Unmanned Underwater Vehicles (UUV) Market Value & Volume, 2019-2024 ($)
Figure 69 Italy GDP and Population, 2018-2019 ($)
Figure 70 Italy GDP – Composition of 2018, By Sector of Origin
Figure 71 Italy Export and Import Value & Volume, 2018-2019 ($)
Figure 72 France Unmanned Underwater Vehicles (UUV) Market Value & Volume, 2019-2024 ($)
Figure 73 France GDP and Population, 2018-2019 ($)
Figure 74 France GDP – Composition of 2018, By Sector of Origin
Figure 75 France Export and Import Value & Volume, 2018-2019 ($)
Figure 76 Netherlands Unmanned Underwater Vehicles (UUV) Market Value & Volume, 2019-2024 ($)
Figure 77 Netherlands GDP and Population, 2018-2019 ($)
Figure 78 Netherlands GDP – Composition of 2018, By Sector of Origin
Figure 79 Netherlands Export and Import Value & Volume, 2018-2019 ($)
Figure 80 Belgium Unmanned Underwater Vehicles (UUV) Market Value & Volume, 2019-2024 ($)
Figure 81 Belgium GDP and Population, 2018-2019 ($)
Figure 82 Belgium GDP – Composition of 2018, By Sector of Origin
Figure 83 Belgium Export and Import Value & Volume, 2018-2019 ($)
Figure 84 Spain Unmanned Underwater Vehicles (UUV) Market Value & Volume, 2019-2024 ($)
Figure 85 Spain GDP and Population, 2018-2019 ($)
Figure 86 Spain GDP – Composition of 2018, By Sector of Origin
Figure 87 Spain Export and Import Value & Volume, 2018-2019 ($)
Figure 88 Denmark Unmanned Underwater Vehicles (UUV) Market Value & Volume, 2019-2024 ($)
Figure 89 Denmark GDP and Population, 2018-2019 ($)
Figure 90 Denmark GDP – Composition of 2018, By Sector of Origin
Figure 91 Denmark Export and Import Value & Volume, 2018-2019 ($)
Figure 92 APAC Unmanned Underwater Vehicles (UUV) Market Value & Volume, 2019-2024 ($)
Figure 93 China Unmanned Underwater Vehicles (UUV) MarketValue & Volume, 2019-2024
Figure 94 China GDP and Population, 2018-2019 ($)
Figure 95 China GDP – Composition of 2018, By Sector of Origin
Figure 96 China Export and Import Value & Volume, 2018-2019 ($)Unmanned Underwater Vehicles (UUV) MarketChina Export and Import Value & Volume, 2018-2019 ($)
Figure 97 Australia Unmanned Underwater Vehicles (UUV) Market Value & Volume, 2019-2024 ($)
Figure 98 Australia GDP and Population, 2018-2019 ($)
Figure 99 Australia GDP – Composition of 2018, By Sector of Origin
Figure 100 Australia Export and Import Value & Volume, 2018-2019 ($)
Figure 101 South Korea Unmanned Underwater Vehicles (UUV) Market Value & Volume, 2019-2024 ($)
Figure 102 South Korea GDP and Population, 2018-2019 ($)
Figure 103 South Korea GDP – Composition of 2018, By Sector of Origin
Figure 104 South Korea Export and Import Value & Volume, 2018-2019 ($)
Figure 105 India Unmanned Underwater Vehicles (UUV) Market Value & Volume, 2019-2024 ($)
Figure 106 India GDP and Population, 2018-2019 ($)
Figure 107 India GDP – Composition of 2018, By Sector of Origin
Figure 108 India Export and Import Value & Volume, 2018-2019 ($)
Figure 109 Taiwan Unmanned Underwater Vehicles (UUV) MarketTaiwan 3D Printing Market Value & Volume, 2019-2024 ($)
Figure 110 Taiwan GDP and Population, 2018-2019 ($)
Figure 111 Taiwan GDP – Composition of 2018, By Sector of Origin
Figure 112 Taiwan Export and Import Value & Volume, 2018-2019 ($)
Figure 113 Malaysia Unmanned Underwater Vehicles (UUV) MarketMalaysia 3D Printing Market Value & Volume, 2019-2024 ($)
Figure 114 Malaysia GDP and Population, 2018-2019 ($)
Figure 115 Malaysia GDP – Composition of 2018, By Sector of Origin
Figure 116 Malaysia Export and Import Value & Volume, 2018-2019 ($)
Figure 117 Hong Kong Unmanned Underwater Vehicles (UUV) MarketHong Kong 3D Printing Market Value & Volume, 2019-2024 ($)
Figure 118 Hong Kong GDP and Population, 2018-2019 ($)
Figure 119 Hong Kong GDP – Composition of 2018, By Sector of Origin
Figure 120 Hong Kong Export and Import Value & Volume, 2018-2019 ($)
Figure 121 Middle East & Africa Unmanned Underwater Vehicles (UUV) MarketMiddle East & Africa 3D Printing Market Value & Volume, 2019-2024 ($)
Figure 122 Russia Unmanned Underwater Vehicles (UUV) MarketRussia 3D Printing Market Value & Volume, 2019-2024 ($)
Figure 123 Russia GDP and Population, 2018-2019 ($)
Figure 124 Russia GDP – Composition of 2018, By Sector of Origin
Figure 125 Russia Export and Import Value & Volume, 2018-2019 ($)
Figure 126 Israel Unmanned Underwater Vehicles (UUV) Market Value & Volume, 2019-2024 ($)
Figure 127 Israel GDP and Population, 2018-2019 ($)
Figure 128 Israel GDP – Composition of 2018, By Sector of Origin
Figure 129 Israel Export and Import Value & Volume, 2018-2019 ($)
Figure 130 Entropy Share, By Strategies, 2018-2019* (%)Unmanned Underwater Vehicles (UUV) Market
Figure 131 Developments, 2018-2019*Unmanned Underwater Vehicles (UUV) Market
Figure 132 Company 1 Unmanned Underwater Vehicles (UUV) Market Net Revenue, By Years, 2018-2019* ($)
Figure 133 Company 1 Unmanned Underwater Vehicles (UUV) Market Net Revenue Share, By Business segments, 2018 (%)
Figure 134 Company 1 Unmanned Underwater Vehicles (UUV) Market Net Sales Share, By Geography, 2018 (%)
Figure 135 Company 2 Unmanned Underwater Vehicles (UUV) Market Net Revenue, By Years, 2018-2019* ($)
Figure 136 Company 2 Unmanned Underwater Vehicles (UUV) Market Net Revenue Share, By Business segments, 2018 (%)
Figure 137 Company 2 Unmanned Underwater Vehicles (UUV) Market Net Sales Share, By Geography, 2018 (%)
Figure 138 Company 3Unmanned Underwater Vehicles (UUV) Market Net Revenue, By Years, 2018-2019* ($)
Figure 139 Company 3Unmanned Underwater Vehicles (UUV) Market Net Revenue Share, By Business segments, 2018 (%)
Figure 140 Company 3Unmanned Underwater Vehicles (UUV) Market Net Sales Share, By Geography, 2018 (%)
Figure 141 Company 4 Unmanned Underwater Vehicles (UUV) Market Net Revenue, By Years, 2018-2019* ($)
Figure 142 Company 4 Unmanned Underwater Vehicles (UUV) Market Net Revenue Share, By Business segments, 2018 (%)
Figure 143 Company 4 Unmanned Underwater Vehicles (UUV) Market Net Sales Share, By Geography, 2018 (%)
Figure 144 Company 5 Unmanned Underwater Vehicles (UUV) Market Net Revenue, By Years, 2018-2019* ($)
Figure 145 Company 5 Unmanned Underwater Vehicles (UUV) Market Net Revenue Share, By Business segments, 2018 (%)
Figure 146 Company 5 Unmanned Underwater Vehicles (UUV) Market Net Sales Share, By Geography, 2018 (%)
Figure 147 Company 6 Unmanned Underwater Vehicles (UUV) Market Net Revenue, By Years, 2018-2019* ($)
Figure 148 Company 6 Unmanned Underwater Vehicles (UUV) Market Net Revenue Share, By Business segments, 2018 (%)
Figure 149 Company 6 Unmanned Underwater Vehicles (UUV) Market Net Sales Share, By Geography, 2018 (%)
Figure 150 Company 7 Unmanned Underwater Vehicles (UUV) Market Net Revenue, By Years, 2018-2019* ($)
Figure 151 Company 7 Unmanned Underwater Vehicles (UUV) Market Net Revenue Share, By Business segments, 2018 (%)
Figure 152 Company 7 Unmanned Underwater Vehicles (UUV) Market Net Sales Share, By Geography, 2018 (%)
Figure 153 Company 8 Unmanned Underwater Vehicles (UUV) Market Net Revenue, By Years, 2018-2019* ($)
Figure 154 Company 8 Unmanned Underwater Vehicles (UUV) Market Net Revenue Share, By Business segments, 2018 (%)
Figure 155 Company 8 Unmanned Underwater Vehicles (UUV) Market Net Sales Share, By Geography, 2018 (%)
Figure 156 Company 9 Unmanned Underwater Vehicles (UUV) Market Net Revenue, By Years, 2018-2019* ($)
Figure 157 Company 9 Unmanned Underwater Vehicles (UUV) Market Net Revenue Share, By Business segments, 2018 (%)
Figure 158 Company 9 Unmanned Underwater Vehicles (UUV) Market Net Sales Share, By Geography, 2018 (%)
Figure 159 Company 10 Unmanned Underwater Vehicles (UUV) Market Net Revenue, By Years, 2018-2019* ($)
Figure 160 Company 10 Unmanned Underwater Vehicles (UUV) Market Net Revenue Share, By Business segments, 2018 (%)
Figure 161 Company 10 Unmanned Underwater Vehicles (UUV) Market Net Sales Share, By Geography, 2018 (%)
Figure 162 Company 11 Unmanned Underwater Vehicles (UUV) Market Net Revenue, By Years, 2018-2019* ($)
Figure 163 Company 11 Unmanned Underwater Vehicles (UUV) Market Net Revenue Share, By Business segments, 2018 (%)
Figure 164 Company 11 Unmanned Underwater Vehicles (UUV) Market Net Sales Share, By Geography, 2018 (%)
Figure 165 Company 12 Unmanned Underwater Vehicles (UUV) Market Net Revenue, By Years, 2018-2019* ($)
Figure 166 Company 12 Unmanned Underwater Vehicles (UUV) Market Net Revenue Share, By Business segments, 2018 (%)
Figure 167 Company 12 Unmanned Underwater Vehicles (UUV) Market Net Sales Share, By Geography, 2018 (%)
Figure 168 Company 13Unmanned Underwater Vehicles (UUV) Market Net Revenue, By Years, 2018-2019* ($)
Figure 169 Company 13Unmanned Underwater Vehicles (UUV) Market Net Revenue Share, By Business segments, 2018 (%)
Figure 170 Company 13Unmanned Underwater Vehicles (UUV) Market Net Sales Share, By Geography, 2018 (%)
Figure 171 Company 14 Unmanned Underwater Vehicles (UUV) Market Net Revenue, By Years, 2018-2019* ($)
Figure 172 Company 14 Unmanned Underwater Vehicles (UUV) Market Net Revenue Share, By Business segments, 2018 (%)
Figure 173 Company 14 Unmanned Underwater Vehicles (UUV) Market Net Sales Share, By Geography, 2018 (%)
Figure 174 Company 15 Unmanned Underwater Vehicles (UUV) Market Net Revenue, By Years, 2018-2019* ($)
Figure 175 Company 15 Unmanned Underwater Vehicles (UUV) Market Net Revenue Share, By Business segments, 2018 (%)
Figure 176 Company 15 Unmanned Underwater Vehicles (UUV) Market Net Sales Share, By Geography, 2018 (%)