 이메일
이메일 인쇄
인쇄


Water Treatment Additives Market - Forecast(2026 - 2031)
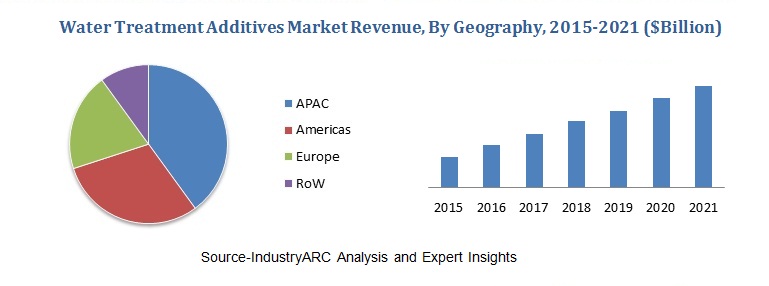
The global water treatment additives market generated a revenue of $29,483m in the year 2017 and expected to grow with a CAGR of 5.9% during the forecast period. The demand for water treatment additives is increasing rapidly due to increase in population, water scarcity and industrialization. In 2017, water industry which includes only drinking water treatment is valued at $6902.6m and will grow at a CAGR of 9.2% during the forecast period. However, the usage of these additives and their impact on the environment is regulated by several authorities such as Environmental Protection Agency (EPA) and Centre for Disease Control and Protection (CDC).
What are Water treatment additives?
Water is essential for life. Hence it is important to treat water before its use. Water treatment is a process of removing contaminants such as suspended solids, microorganisms and hazardous chemicals. A large number of chemical treatment products and specialty additives are used successfully around the world in many of the commercial, municipal and industrial process environments where they help to improve productivity and optimize the treatment method.
The scientifically formulated water additives include wastewater and effluent treatment chemicals, high performance industrial chemicals, reverse osmosis membrane products, eco-friendly biological formulations, advanced polymers and much more.
This report incorporates an in-depth assessment of Water treatment Additives market by type of water treatment, type of adhesives, by applications and geography.
What are the major applications of Water treatment additives?
Water treatment additives are widely used in various industries such as water, chemicals, food, paper, power, oil and gas. These additives improve the quality of water and makes it available for a specific use. For instance, the use of disinfectants kills all the microorganisms in water and hence prevents the wide spread of water borne diseases. The treated water can be used for drinking, industrial purpose, irrigation, water recreation and so on. The different types of additives used are scale inhibitors, corrosion inhibitors, organic polymers, disinfectants, coagulants, pH conditioners and many others which help in neutralization and treatment of waste water.
Market Research and Market Trends of Water treatment additives
- The Metro Wastewater Reclamation District in Denver, Colo. recently began to treat wastewater effluent with a PAA formulation from Enviro Tech Chemical Services, Inc. which is known as Peragreen WW. Though the cost of PAA is higher, this disinfectant which is preferred over sodium hypochlorite as it allows users to avoid issues associated with toxic halogenated compound such as chlorine-containing disinfectants.
- Researchers at Bath University in partnership with Wessex water are testing of algal farming in order to replace the use of chemicals for treating waste water. This method is particularly suited to remove phosphorus from sewage, which is an increasing problem for water treatment and is supposed to be cheaper and more sustainable .
- The wastewater obtained from hospitals include cytostatic drugs which are used in cancer treatment, not only pollute the environment but can also harm human health as these drugs don’t break down easily. A group of researchers from Belgium and India have developed a novel method of treating wastewater, in which they have developed a slurry photo catalytic membrane reactor which carries out filtration in a similar process as used for drinking water with a help of LED light source and the drugs are further broken down with the help of titanium dioxide which is nontoxic and efficient.
- In rural areas, it can be very expensive to build a new water treatment plant or connect with one in the next closest town and also to have an expertise to operate it. Hence, a movable water treatment system was developed at UCLA which fits in a shipping container and can be operated with a smartphone. It can treat agricultural runoff, brackish groundwater and nearly any other water source into potable water. This system is operating successfully in Panoche water district of California since 2017 .
- In 2017, Center for Nanotechnology Enabled Water Treatment (NEWT) which is located at Rice University developed a technology which involves the use of energy from sunlight to transform salt water into fresh drinking water. This desalination system uses a combination of nanophotonics and membrane distillation technique .
Who are the Major Players in Water Treatment additives market?
The market comprises several prominent players such as GE Water & Process Technologies, 3M Purification, Calgon Carbon, Aqua Tech International, Danaher, GDF SUEZ, Degremont, Veolia Water Solutions & Technologies and Siemens.
What is our report scope?
The report incorporates in-depth assessment of the competitive landscape, product market sizing, product benchmarking, market trends, product developments, financial analysis, strategic analysis and so on to gauge the impact forces and potential opportunities of the market. Apart from this the report also includes a study of major developments in the market such as product launches, agreements, acquisitions, collaborations, mergers and so on to comprehend the prevailing market dynamics at present and its impact during the forecast period 2018-2024.
All our reports are customizable to your company needs to a certain extent, we do provide 20 free consulting hours along with purchase of each report, and this will allow you to request any additional data to customize the report to your needs.
Key Takeaways from this Report
- Evaluate market potential through analyzing growth rates (CAGR %), Volume (Units) and Value ($M) data given at country level – for product types, end use applications and by different industry verticals.
- Understand the different dynamics influencing the market – key driving factors, challenges and hidden opportunities.
- Get in-depth insights on your competitor performance – market shares, strategies, financial benchmarking, product benchmarking, SWOT and more.
- Analyze the sales and distribution channels across key geographies to improve top-line revenues.
- Understand the industry supply chain with a deep-dive on the value augmentation at each step, in order to optimize value and bring efficiencies in your processes.
- Get a quick outlook on the market entropy – M&A’s, deals, partnerships, product launches of all key players for the past 4 years.
- Evaluate the supply-demand gaps, import-export statistics and regulatory landscape for more than top 20 countries globally for the market.
1. Water Treatment Additives Market Overview
2. Executive Summary
3. Water Treatment Additives – Market Landscape
3.1. Market Share Analysis
3.2. Comparative Analysis
3.2.1. Product Benchmarking
3.2.2. End user profiling
3.2.3. Top 5 Financials Analysis
4. Water Treatment Additives – Market Forces
4.1. Market Drivers
4.1.1. Lack of fresh water resources with increasing population leads to higher demand of water treatment sector
4.1.2. Growing demand for water treatment additives in developing countries
4.2. Market Constraints
4.2.1. Lack of awareness of the purified water usage by end user
4.3. Market Challenges
4.3.1. Improper distribution facilities of treated water
4.4. Attractiveness of the Water Treatment Additives Industry
4.4.1. Power of Suppliers
4.4.2. Power of Customers
4.4.3. Threat of New entrants
4.4.4. Threat of Substitution
4.4.5. Degree of Competition
5. Water Treatment Additives Market – Strategic Analysis
5.1. Value Chain Analysis
5.2. Pricing Analysis
5.3. Opportunities Analysis
5.4. Product/Market Life Cycle Analysis
5.5. Suppliers and Distributors
6. Water Treatment Additives Market – By Type of Water Treatment
6.1. Water Treatment
6.1.1. Drinking Water Treatment
6.1.2. Industrial Water Treatment
6.2. Wastewater Treatment
6.2.1. Industrial Wastewater Treatment
6.2.2. Public Utility Wastewater Treatment
7. Water Treatment Additives Market – By Type of Additives
7.1. Scale Inhibitors
7.1.1. Phosphate esters
7.1.2. Phosphoric acid
7.1.3. Low molecular weight polyacrylic acids
7.2. Corrosion Inhibitors
7.2.1. Passivity inhibitors
7.2.2. Cathodic inhibitors
7.2.3. Organic inhibitors
7.2.4. Precipitation inducing inhibitors
7.2.5. Volatile Corrosion inhibitors
7.3. Defoamer
7.4. Antifoam
7.5. Organic Polymers
7.6. Oxygen Scavengers
7.7. Disinfectant
7.7.1. Chlorine
7.7.2. Chlorine dioxide
7.7.3. Ozone
7.7.4. Hypochlorite
7.8. Algaecides
7.9. Coagulants
7.10. Resin cleaners
7.11. pH conditioners
7.12. Others
8. Water Treatment Additives Market – By Application
8.1. Water Industry
8.2. Power Generation
8.3. Waste Water Industry
8.4. Oil & Gas Industry
8.5. Paper Industry
8.6. Food & Beverage Industry
8.7. Electronics Industry
8.8. Chemicals Industry
8.9. Others
9. Water Treatment Additives Market—By Geography
9.1. North America
9.1.1. U.S.
9.1.2. Canada
9.1.3. Mexico
9.1.4. Rest of North America
9.2. South America
9.2.1. Brazil
9.2.2. Venezuela
9.2.3. Argentina
9.2.4. Ecuador
9.2.5. Peru
9.2.6. Colombia
9.2.7. Costa Rica
9.2.8. Rest of South America
9.3. Europe
9.3.1. U.K
9.3.2. Germany
9.3.3. Italy
9.3.4. France
9.3.5. Netherlands
9.3.6. Belgium
9.3.7. Spain
9.3.8. Denmark
9.3.9. Rest of Europe
9.4. APAC
9.4.1. China
9.4.2. Australia
9.4.3. South Korea
9.4.4. India
9.4.5. Taiwan
9.4.6. Malaysia
9.4.7. Hong Kong
9.4.8. Rest of APAC
9.5. Middle East& Africa
9.5.1. Israel
9.5.2. South Africa
9.5.3. Saudi Arabia
9.6. Rest of Middle East and Africa
10. Market Entropy
10.1. New Product Launches
10.2. M&As, Collaborations, JVs and Partnerships
11. Company Profiles
11.1. GE Water & Process Technologies
11.2. 3M Purification
11.3. Calgon Carbon
11.4. GDF SUEZ
11.5. Degremont
11.6. Aqua Tech International
11.7. Danaher
11.8. Company 8
11.9. Company 9
11.10. Company 10
*More than 10 Companies are profiled in this Research Report*
"*Financials would be provided on a best efforts basis for private companies"
12. Appendix
12.1. Abbreviations
12.2. Sources
12.3. Research Methodology
List of Tables:
Table 1: Water Treatment Additives Market Overview 2019-2024
Table 2: Water Treatment Additives Market Leader Analysis 2018-2019 (US$)
Table 3: Water Treatment Additives Market Product Analysis 2018-2019 (US$)
Table 4: Water Treatment Additives Market End User Analysis 2018-2019 (US$)
Table 5: Water Treatment Additives Market Patent Analysis 2013-2018* (US$)
Table 6: Water Treatment Additives Market Financial Analysis 2018-2019 (US$)
Table 7: Water Treatment Additives Market Driver Analysis 2018-2019 (US$)
Table 8: Water Treatment Additives Market Challenges Analysis 2018-2019 (US$)
Table 9: Water Treatment Additives Market Constraint Analysis 2018-2019 (US$)
Table 10: Water Treatment Additives Market Supplier Bargaining Power Analysis 2018-2019 (US$)
Table 11: Water Treatment Additives Market Buyer Bargaining Power Analysis 2018-2019 (US$)
Table 12: Water Treatment Additives Market Threat of Substitutes Analysis 2018-2019 (US$)
Table 13: Water Treatment Additives Market Threat of New Entrants Analysis 2018-2019 (US$)
Table 14: Water Treatment Additives Market Degree of Competition Analysis 2018-2019 (US$)
Table 15: Water Treatment Additives Market Value Chain Analysis 2018-2019 (US$)
Table 16: Water Treatment Additives Market Pricing Analysis 2019-2024 (US$)
Table 17: Water Treatment Additives Market Opportunities Analysis 2019-2024 (US$)
Table 18: Water Treatment Additives Market Product Life Cycle Analysis 2019-2024 (US$)
Table 19: Water Treatment Additives Market Supplier Analysis 2018-2019 (US$)
Table 20: Water Treatment Additives Market Distributor Analysis 2018-2019 (US$)
Table 21: Water Treatment Additives Market Trend Analysis 2018-2019 (US$)
Table 22: Water Treatment Additives Market Size 2018 (US$)
Table 23: Water Treatment Additives Market Forecast Analysis 2019-2024 (US$)
Table 24: Water Treatment Additives Market Sales Forecast Analysis 2019-2024 (Units)
Table 25: Water Treatment Additives Market, Revenue & Volume, By Type of Additives, 2019-2024 ($)
Table 26: Water Treatment Additives Market By Type of Additives, Revenue & Volume, By Inorganic Coagulants, 2019-2024 ($)
Table 27: Water Treatment Additives Market By Type of Additives, Revenue & Volume, By Organic Coagulants, 2019-2024 ($)
Table 28: Water Treatment Additives Market By Type of Additives, Revenue & Volume, By Flocculants, 2019-2024 ($)
Table 29: Water Treatment Additives Market By Type of Additives, Revenue & Volume, By Biocides, 2019-2024 ($)
Table 30: Water Treatment Additives Market By Type of Additives, Revenue & Volume, By Scale Inhibitors, 2019-2024 ($)
Table 31: Water Treatment Additives Market, Revenue & Volume, By End User, 2019-2024 ($)
Table 32: Water Treatment Additives Market By End User, Revenue & Volume, By Chemical Processing Industry, 2019-2024 ($)
Table 33: Water Treatment Additives Market By End User, Revenue & Volume, By Food & Beverage, 2019-2024 ($)
Table 34: Water Treatment Additives Market By End User, Revenue & Volume, By Meat, Poultry and Seafood, 2019-2024 ($)
Table 35: Water Treatment Additives Market By End User, Revenue & Volume, By Hydrocarbon Processing, 2019-2024 ($)
Table 36: Water Treatment Additives Market By End User, Revenue & Volume, By Healthcare, 2019-2024 ($)
Table 37: North America Water Treatment Additives Market, Revenue & Volume, By Type of Additives, 2019-2024 ($)
Table 38: North America Water Treatment Additives Market, Revenue & Volume, By End User, 2019-2024 ($)
Table 39: South america Water Treatment Additives Market, Revenue & Volume, By Type of Additives, 2019-2024 ($)
Table 40: South america Water Treatment Additives Market, Revenue & Volume, By End User, 2019-2024 ($)
Table 41: Europe Water Treatment Additives Market, Revenue & Volume, By Type of Additives, 2019-2024 ($)
Table 42: Europe Water Treatment Additives Market, Revenue & Volume, By End User, 2019-2024 ($)
Table 43: APAC Water Treatment Additives Market, Revenue & Volume, By Type of Additives, 2019-2024 ($)
Table 44: APAC Water Treatment Additives Market, Revenue & Volume, By End User, 2019-2024 ($)
Table 45: Middle East & Africa Water Treatment Additives Market, Revenue & Volume, By Type of Additives, 2019-2024 ($)
Table 46: Middle East & Africa Water Treatment Additives Market, Revenue & Volume, By End User, 2019-2024 ($)
Table 47: Russia Water Treatment Additives Market, Revenue & Volume, By Type of Additives, 2019-2024 ($)
Table 48: Russia Water Treatment Additives Market, Revenue & Volume, By End User, 2019-2024 ($)
Table 49: Israel Water Treatment Additives Market, Revenue & Volume, By Type of Additives, 2019-2024 ($)
Table 50: Israel Water Treatment Additives Market, Revenue & Volume, By End User, 2019-2024 ($)
Table 51: Top Companies 2018 (US$) Water Treatment Additives Market, Revenue & Volume
Table 52: Product Launch 2018-2019 Water Treatment Additives Market, Revenue & Volume
Table 53: Mergers & Acquistions 2018-2019 Water Treatment Additives Market, Revenue & Volume
List of Figures:
Figure 1: Overview of Water Treatment Additives Market 2019-2024
Figure 2: Market Share Analysis for Water Treatment Additives Market 2018 (US$)
Figure 3: Product Comparison in Water Treatment Additives Market 2018-2019 (US$)
Figure 4: End User Profile for Water Treatment Additives Market 2018-2019 (US$)
Figure 5: Patent Application and Grant in Water Treatment Additives Market 2013-2018* (US$)
Figure 6: Top 5 Companies Financial Analysis in Water Treatment Additives Market 2018-2019 (US$)
Figure 7: Market Entry Strategy in Water Treatment Additives Market 2018-2019
Figure 8: Ecosystem Analysis in Water Treatment Additives Market 2018
Figure 9: Average Selling Price in Water Treatment Additives Market 2019-2024
Figure 10: Top Opportunites in Water Treatment Additives Market 2018-2019
Figure 11: Market Life Cycle Analysis in Water Treatment Additives Market
Figure 12: GlobalBy Type of Additives Water Treatment Additives Market Revenue, 2019-2024 ($)
Figure 13: GlobalBy End User Water Treatment Additives Market Revenue, 2019-2024 ($)
Figure 14: Global Water Treatment Additives Market - By Geography
Figure 15: Global Water Treatment Additives Market Value & Volume, By Geography, 2019-2024 ($)
Figure 16: Global Water Treatment Additives Market CAGR, By Geography, 2019-2024 (%)
Figure 17: North America Water Treatment Additives Market Value & Volume, 2019-2024 ($)
Figure 18: US Water Treatment Additives Market Value & Volume, 2019-2024 ($)
Figure 19: US GDP and Population, 2018-2019 ($)
Figure 20: US GDP – Composition of 2018, By Sector of Origin
Figure 21: US Export and Import Value & Volume, 2018-2019 ($)
Figure 22: Canada Water Treatment Additives Market Value & Volume, 2019-2024 ($)
Figure 23: Canada GDP and Population, 2018-2019 ($)
Figure 24: Canada GDP – Composition of 2018, By Sector of Origin
Figure 25: Canada Export and Import Value & Volume, 2018-2019 ($)
Figure 26: Mexico Water Treatment Additives Market Value & Volume, 2019-2024 ($)
Figure 27: Mexico GDP and Population, 2018-2019 ($)
Figure 28: Mexico GDP – Composition of 2018, By Sector of Origin
Figure 29: Mexico Export and Import Value & Volume, 2018-2019 ($)
Figure 30: South America Water Treatment Additives Market Value & Volume, 2019-2024 ($)
Figure 31: Brazil Water Treatment Additives Market Value & Volume, 2019-2024 ($)
Figure 32: Brazil GDP and Population, 2018-2019 ($)
Figure 33: Brazil GDP – Composition of 2018, By Sector of Origin
Figure 34: Brazil Export and Import Value & Volume, 2018-2019 ($)
Figure 35: Venezuela Water Treatment Additives Market Value & Volume, 2019-2024 ($)
Figure 36: Venezuela GDP and Population, 2018-2019 ($)
Figure 37: Venezuela GDP – Composition of 2018, By Sector of Origin
Figure 38: Venezuela Export and Import Value & Volume, 2018-2019 ($)
Figure 39: Argentina Water Treatment Additives Market Value & Volume, 2019-2024 ($)
Figure 40: Argentina GDP and Population, 2018-2019 ($)
Figure 41: Argentina GDP – Composition of 2018, By Sector of Origin
Figure 42: Argentina Export and Import Value & Volume, 2018-2019 ($)
Figure 43: Ecuador Water Treatment Additives Market Value & Volume, 2019-2024 ($)
Figure 44: Ecuador GDP and Population, 2018-2019 ($)
Figure 45: Ecuador GDP – Composition of 2018, By Sector of Origin
Figure 46: Ecuador Export and Import Value & Volume, 2018-2019 ($)
Figure 47: Peru Water Treatment Additives Market Value & Volume, 2019-2024 ($)
Figure 48: Peru GDP and Population, 2018-2019 ($)
Figure 49: Peru GDP – Composition of 2018, By Sector of Origin
Figure 50: Peru Export and Import Value & Volume, 2018-2019 ($)
Figure 51: Colombia Water Treatment Additives Market Value & Volume, 2019-2024 ($)
Figure 52: Colombia GDP and Population, 2018-2019 ($)
Figure 53: Colombia GDP – Composition of 2018, By Sector of Origin
Figure 54: Colombia Export and Import Value & Volume, 2018-2019 ($)
Figure 55: Costa Rica Water Treatment Additives Market Value & Volume, 2019-2024 ($)
Figure 56: Costa Rica GDP and Population, 2018-2019 ($)
Figure 57: Costa Rica GDP – Composition of 2018, By Sector of Origin
Figure 58: Costa Rica Export and Import Value & Volume, 2018-2019 ($)
Figure 59: Europe Water Treatment Additives Market Value & Volume, 2019-2024 ($)
Figure 60: U.K Water Treatment Additives Market Value & Volume, 2019-2024 ($)
Figure 61: U.K GDP and Population, 2018-2019 ($)
Figure 62: U.K GDP – Composition of 2018, By Sector of Origin
Figure 63: U.K Export and Import Value & Volume, 2018-2019 ($)
Figure 64: Germany Water Treatment Additives Market Value & Volume, 2019-2024 ($)
Figure 65: Germany GDP and Population, 2018-2019 ($)
Figure 66: Germany GDP – Composition of 2018, By Sector of Origin
Figure 67: Germany Export and Import Value & Volume, 2018-2019 ($)
Figure 68: Italy Water Treatment Additives Market Value & Volume, 2019-2024 ($)
Figure 69: Italy GDP and Population, 2018-2019 ($)
Figure 70: Italy GDP – Composition of 2018, By Sector of Origin
Figure 71: Italy Export and Import Value & Volume, 2018-2019 ($)
Figure 72: France Water Treatment Additives Market Value & Volume, 2019-2024 ($)
Figure 73: France GDP and Population, 2018-2019 ($)
Figure 74: France GDP – Composition of 2018, By Sector of Origin
Figure 75: France Export and Import Value & Volume, 2018-2019 ($)
Figure 76: Netherlands Water Treatment Additives Market Value & Volume, 2019-2024 ($)
Figure 77: Netherlands GDP and Population, 2018-2019 ($)
Figure 78: Netherlands GDP – Composition of 2018, By Sector of Origin
Figure 79: Netherlands Export and Import Value & Volume, 2018-2019 ($)
Figure 80: Belgium Water Treatment Additives Market Value & Volume, 2019-2024 ($)
Figure 81: Belgium GDP and Population, 2018-2019 ($)
Figure 82: Belgium GDP – Composition of 2018, By Sector of Origin
Figure 83: Belgium Export and Import Value & Volume, 2018-2019 ($)
Figure 84: Spain Water Treatment Additives Market Value & Volume, 2019-2024 ($)
Figure 85: Spain GDP and Population, 2018-2019 ($)
Figure 86: Spain GDP – Composition of 2018, By Sector of Origin
Figure 87: Spain Export and Import Value & Volume, 2018-2019 ($)
Figure 88: Denmark Water Treatment Additives Market Value & Volume, 2019-2024 ($)
Figure 89: Denmark GDP and Population, 2018-2019 ($)
Figure 90: Denmark GDP – Composition of 2018, By Sector of Origin
Figure 91: Denmark Export and Import Value & Volume, 2018-2019 ($)
Figure 92: APAC Water Treatment Additives Market Value & Volume, 2019-2024 ($)
Figure 93: China Water Treatment Additives Market Value & Volume, 2019-2024
Figure 94: China GDP and Population, 2018-2019 ($)
Figure 95: China GDP – Composition of 2018, By Sector of Origin
Figure 96: China Export and Import Value & Volume, 2018-2019 ($) Water Treatment Additives Market China Export and Import Value & Volume, 2018-2019 ($)
Figure 97: Australia Water Treatment Additives Market Value & Volume, 2019-2024 ($)
Figure 98: Australia GDP and Population, 2018-2019 ($)
Figure 99: Australia GDP – Composition of 2018, By Sector of Origin
Figure 100: Australia Export and Import Value & Volume, 2018-2019 ($)
Figure 101: South Korea Water Treatment Additives Market Value & Volume, 2019-2024 ($)
Figure 102: South Korea GDP and Population, 2018-2019 ($)
Figure 103: South Korea GDP – Composition of 2018, By Sector of Origin
Figure 104: South Korea Export and Import Value & Volume, 2018-2019 ($)
Figure 105: India Water Treatment Additives Market Value & Volume, 2019-2024 ($)
Figure 106: India GDP and Population, 2018-2019 ($)
Figure 107: India GDP – Composition of 2018, By Sector of Origin
Figure 108: India Export and Import Value & Volume, 2018-2019 ($)
Figure 109: Taiwan Water Treatment Additives Market Value & Volume, 2019-2024 ($)
Figure 110: Taiwan GDP and Population, 2018-2019 ($)
Figure 111: Taiwan GDP – Composition of 2018, By Sector of Origin
Figure 112: Taiwan Export and Import Value & Volume, 2018-2019 ($)
Figure 113: Malaysia Water Treatment Additives Market Value & Volume, 2019-2024 ($)
Figure 114: Malaysia GDP and Population, 2018-2019 ($)
Figure 115: Malaysia GDP – Composition of 2018, By Sector of Origin
Figure 116: Malaysia Export and Import Value & Volume, 2018-2019 ($)
Figure 117: Hong Kong Water Treatment Additives Market Value & Volume, 2019-2024 ($)
Figure 118: Hong Kong GDP and Population, 2018-2019 ($)
Figure 119: Hong Kong GDP – Composition of 2018, By Sector of Origin
Figure 120: Hong Kong Export and Import Value & Volume, 2018-2019 ($)
Figure 121: Middle East & Africa Water Treatment Additives Market Middle East & Africa 3D Printing Market Value & Volume, 2019-2024 ($)
Figure 122: Russia Water Treatment Additives Market Value & Volume, 2019-2024 ($)
Figure 123: Russia GDP and Population, 2018-2019 ($)
Figure 124: Russia GDP – Composition of 2018, By Sector of Origin
Figure 125: Russia Export and Import Value & Volume, 2018-2019 ($)
Figure 126: Israel Water Treatment Additives Market Value & Volume, 2019-2024 ($)
Figure 127: Israel GDP and Population, 2018-2019 ($)
Figure 128: Israel GDP – Composition of 2018, By Sector of Origin
Figure 129: Israel Export and Import Value & Volume, 2018-2019 ($)
Figure 130: Entropy Share, By Strategies, 2018-2019* (%) Water Treatment Additives Market
Figure 131: Developments, 2018-2019* Water Treatment Additives Market
Figure 132: Company 1 Water Treatment Additives Market Net Revenue, By Years, 2018-2019* ($)
Figure 133: Company 1 Water Treatment Additives Market Net Revenue Share, By Business segments, 2018 (%)
Figure 134: Company 1 Water Treatment Additives Market Net Sales Share, By Geography, 2018 (%)
Figure 135: Company 2 Water Treatment Additives Market Net Revenue, By Years, 2018-2019* ($)
Figure 136: Company 2 Water Treatment Additives Market Net Revenue Share, By Business segments, 2018 (%)
Figure 137: Company 2 Water Treatment Additives Market Net Sales Share, By Geography, 2018 (%)
Figure 138: Company 3 Water Treatment Additives Market Net Revenue, By Years, 2018-2019* ($)
Figure 139: Company 3 Water Treatment Additives Market Net Revenue Share, By Business segments, 2018 (%)
Figure 140: Company 3 Water Treatment Additives Market Net Sales Share, By Geography, 2018 (%)
Figure 141: Company 4 Water Treatment Additives Market Net Revenue, By Years, 2018-2019* ($)
Figure 142: Company 4 Water Treatment Additives Market Net Revenue Share, By Business segments, 2018 (%)
Figure 143: Company 4 Water Treatment Additives Market Net Sales Share, By Geography, 2018 (%)
Figure 144: Company 5 Water Treatment Additives Market Net Revenue, By Years, 2018-2019* ($)
Figure 145: Company 5 Water Treatment Additives Market Net Revenue Share, By Business segments, 2018 (%)
Figure 146: Company 5 Water Treatment Additives Market Net Sales Share, By Geography, 2018 (%)
Figure 147: Company 6 Water Treatment Additives Market Net Revenue, By Years, 2018-2019* ($)
Figure 148: Company 6 Water Treatment Additives Market Net Revenue Share, By Business segments, 2018 (%)
Figure 149: Company 6 Water Treatment Additives Market Net Sales Share, By Geography, 2018 (%)
Figure 150: Company 7 Water Treatment Additives Market Net Revenue, By Years, 2018-2019* ($)
Figure 151: Company 7 Water Treatment Additives Market Net Revenue Share, By Business segments, 2018 (%)
Figure 152: Company 7 Water Treatment Additives Market Net Sales Share, By Geography, 2018 (%)
Figure 153: Company 8 Water Treatment Additives Market Net Revenue, By Years, 2018-2019* ($)
Figure 154: Company 8 Water Treatment Additives Market Net Revenue Share, By Business segments, 2018 (%)
Figure 155: Company 8 Water Treatment Additives Market Net Sales Share, By Geography, 2018 (%)
Figure 156: Company 9 Water Treatment Additives Market Net Revenue, By Years, 2018-2019* ($)
Figure 157: Company 9 Water Treatment Additives Market Net Revenue Share, By Business segments, 2018 (%)
Figure 158: Company 9 Water Treatment Additives Market Net Sales Share, By Geography, 2018 (%)
Figure 159: Company 10 Water Treatment Additives Market Net Revenue, By Years, 2018-2019* ($)
Figure 160: Company 10 Water Treatment Additives Market Net Revenue Share, By Business segments, 2018 (%)
Figure 161: Company 10 Water Treatment Additives Market Net Sales Share, By Geography, 2018 (%)
Figure 162: Company 11 Water Treatment Additives Market Net Revenue, By Years, 2018-2019* ($)
Figure 163: Company 11 Water Treatment Additives Market Net Revenue Share, By Business segments, 2018 (%)
Figure 164: Company 11 Water Treatment Additives Market Net Sales Share, By Geography, 2018 (%)
Figure 165: Company 12 Water Treatment Additives Market Net Revenue, By Years, 2018-2019* ($)
Figure 166: Company 12 Water Treatment Additives Market Net Revenue Share, By Business segments, 2018 (%)
Figure 167: Company 12 Water Treatment Additives Market Net Sales Share, By Geography, 2018 (%)
Figure 168: Company 13 Water Treatment Additives Market Net Revenue, By Years, 2018-2019* ($)
Figure 169: Company 13 Water Treatment Additives Market Net Revenue Share, By Business segments, 2018 (%)
Figure 170: Company 13 Water Treatment Additives Market Net Sales Share, By Geography, 2018 (%)
Figure 171: Company 14 Water Treatment Additives Market Net Revenue, By Years, 2018-2019* ($)
Figure 172: Company 14 Water Treatment Additives Market Net Revenue Share, By Business segments, 2018 (%)
Figure 173: Company 14 Water Treatment Additives Market Net Sales Share, By Geography, 2018 (%)
Figure 174: Company 15 Water Treatment Additives Market Net Revenue, By Years, 2018-2019* ($)
Figure 175: Company 15 Water Treatment Additives Market Net Revenue Share, By Business segments, 2018 (%)
Figure 176: Company 15 Water Treatment Additives Market Net Sales Share, By Geography, 2018 (%)