 이메일
이메일 인쇄
인쇄


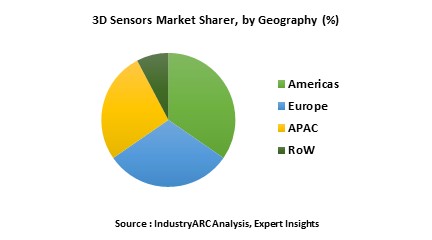
The global 3D sensor market was valued $1997.14 million in the year 2017 and is anticipated to grow with a CAGR of 26.54% from the year 2018 to 2023. 3D sensor market is segmented by technology in which MEMS is having the highest market share and followed by image sensors which are valued $1628.57 and $1104.76 million in the year 2017 and is expected to grow with a CAGR of 5% and 33% during 2018 to 2023. APAC region is having the highest market share of $287.35 million in the year 2017 and is expected to grow with a CAGR of 55% during 2018 to 2023.
What is a 3D sensor?
Three dimensional sensors are depth sensing devices which aims at connecting the devices with the real world by using projected light and a camera system. 3D sensors have a wide application in modern life. This ranges from cameras to drones and robots. These sensors transmit data with a high speed, consume less power and are portable. The technology used in 3D sensors is stereo vision, structured light, time of flight and ultrasound. The different types of products include image sensor, pressure sensor, temperature sensor and proximity sensor.
This report incorporates an in-depth assessment of 3D sensor market by consumer electronics type, key technology type, by end user verticals and geography.
What are the major applications of 3D sensor?
The various end users assessed includes automotive, healthcare, consumer electronics, robotics and defense and among others. In consumer electronics, 3D sensors are widely used in television, smart phones and laptops. All the smartphone manufacturers are trying to incorporate 3D sensing technology in gaming, face recognition and so on. The 3D sensors are employed in healthcare industry to view the inner layers of skin, tumor and veins. 3D sensors are widely used in automotive industry to get an indication of danger, traffic in order to avoid accidents. 3D sensors are also incorporated in wearable devices along with the use of nanotechnology. The applications of 3D sensors will keep growing as there are novel inventions in electronics, automotive and other industries.
Market Research and Market Trends of 3D Sensor Market
- Companies are focusing on manufacturing 3D imaging sensors which can penetrate through walls. This feature would aid the cable companies, broadband and smart home sectors. This feature will enhance the security in our homes and can help in monitoring the activities of many people in a room. The feature requires little work in installation and is affordable as it does not require multiple sensors.
- 3D sensor technology has proven to be useful in the automotive sector as it can be used by long distance drivers to monitor their own behavior. This device can be placed inside the trucks interior which detects the driver’s motion and warns if they seem to be sleeping while driving.
- Companies are implementing 3D sensors for Gesture recognition in user interface. This technology can be used to control games or entertainment devices by mere gestures. In order to meet the needs of our gesture and 3D sensing customers, manufacturers are integrating this technology with other optical elements, electronic drivers, and control logic which can be customized to meet the specific applications.
- The recent development in smartphone technology is involving the use of Simultaneous Localization, Mapping and Augmented Reality. This technology will be of great use as it will help the medical personnel to reconstruct 3D body sections quickly, by directing the smartphone to the area of interest and view the minute details which are invisible otherwise. This approach will allow the doctors to view the inner body segments such as tumors, veins and different ulcers.
Who are the Major Players in 3D Sensor Market?
The companies referred in the market research report includes PMD technologies, Microchip Technologies, Movea SA, Omnivision, Pointgrab, Qualcomm Inc., Reactrix, Samsung Electronics, Softkinetic, Sony Corp, Texas Instrument, Cognivue Corp and many others.
What is our report scope?
The report incorporates in-depth assessment of the competitive landscape, product market sizing, product benchmarking, market trends, product developments, financial analysis, strategic analysis and so on to gauge the impact forces and potential opportunities of the market. Apart from this the report also includes a study of major developments in the market such as product launches, agreements, acquisitions, collaborations, mergers and so on to comprehend the prevailing market dynamics at present and its impact during the forecast period 2018-2024.
All our reports are customizable to your company needs to a certain extent, we do provide 20 free consulting hours along with purchase of each report, and this will allow you to request any additional data to customize the report to your needs.
Key Takeaways from this Report
- Evaluate market potential through analyzing growth rates (CAGR %), Volume (Units) and Value ($M) data given at country level – for product types, end use applications and by different industry verticals.
- Understand the different dynamics influencing the market – key driving factors, challenges and hidden opportunities.
- Get in-depth insights on your competitor performance – market shares, strategies, financial benchmarking, product benchmarking, SWOT and more.
- Analyze the sales and distribution channels across key geographies to improve top-line revenues.
- Understand the industry supply chain with a deep-dive on the value augmentation at each step, in order to optimize value and bring efficiencies in your processes.
- Get a quick outlook on the market entropy – M&A’s, deals, partnerships, product launches of all key players for the past 4 years.
- Evaluate the supply-demand gaps, import-export statistics and regulatory landscape for more than top 20 countries globally for the market.
1. 3D Sensors Market - Overview
1.1. Definitions and Scope
2. 3D Sensors Market - Executive summary
2.1. Market Revenue, Market Size and Key Trends by Company
2.2. Key Trends by type of Application
2.3. Key Trends segmented by Geography
3. 3D Sensors Market
3.1. Comparative analysis
3.1.1. Product Benchmarking - Top 10 companies
3.1.2. Top 5 Financials Analysis
3.1.3. Market Value split by Top 10 companies
3.1.4. Patent Analysis - Top 10 companies
3.1.5. Pricing Analysis
4. 3D Sensors Market – Startup companies Scenario Premium
4.1. Top 10 startup company Analysis by
4.1.1. Investment
4.1.2. Revenue
4.1.3. Market Shares
4.1.4. Market Size and Application Analysis
4.1.5. Venture Capital and Funding Scenario
5. 3D Sensors Market – Industry Market Entry Scenario Premium
5.1. Regulatory Framework Overview
5.2. New Business and Ease of Doing business index
5.3. Case studies of successful ventures
5.4. Customer Analysis – Top 10 companies
6. 3D Sensors Market Forces
6.1. Drivers
6.2. Constraints
6.3. Challenges
6.4. Porters five force model
6.4.1. Bargaining power of suppliers
6.4.2. Bargaining powers of customers
6.4.3. Threat of new entrants
6.4.4. Rivalry among existing players
6.4.5. Threat of substitutes
7. 3D Sensors Market - Strategic analysis
7.1. Value chain analysis
7.2. Opportunities analysis
7.3. Product life cycle
7.4. Suppliers and distributors Market Share
8. 3D Sensors Market – By type (Market Size -$Million / $Billion)
8.1. Market Size and Market Share Analysis
8.2. Application Revenue and Trend Research
8.3. Product Segment Analysis
8.3.1. Image sensor
8.3.2. Position sensor
8.3.3. Temperature sensor
8.3.4. Pressure sensor
8.3.5. Accelerometer sensor
8.3.6. Acoustic sensor
8.3.7. Others
9. 3D Sensors Market – By Key Technology Types (Market Size -$Million / $Billion)
9.1. Interactive Displays
9.2. Capacitive Sensing
9.3. Infrared Sensing
9.4. Ultrasound
9.5. Electric Field
9.6 MEMS
9.9. Camera based recognition 3D
9.8. Structured light
9.9. Time of flight (Photo Electric)
9.10. Stereoscopic vision
9.11. Laser
10. 3D Sensors – By End Use Verticals(Market Size -$Million / $Billion)
10.1. Segment type Size and Market Share Analysis
10.2. Application Revenue and Trends by type of Application
10.3. Application Segment Analysis by Type
10.3.1. Consumer Electronics (AR, VR, Mobiles etc.)
10.3.2. Automotive
10.3.3. Industrial Automation (Packaging, Picking, Sorting etc)
10.3.4. Robotics
10.3.5. Medical Devices
10.3.6. Aerospace
10.3.7. Defense
10.3.8. Logistics, Warehouses & Others
11. 3D Sensors - By Geography (Market Size -$Million / $Billion)
11.1. 3D Sensors Market - North America Segment Research
11.2. North America Market Research (Million / $Billion)
11.2.1. Segment type Size and Market Size Analysis
11.2.2. Revenue and Trends
11.2.3. Application Revenue and Trends by type of Application
11.2.4. Company Revenue and Product Analysis
11.2.5. North America Product type and Application Market Size
11.2.5.1. U.S.
11.2.5.2. Canada
11.2.5.3. Mexico
11.2.5.4. Rest of North America
11.3. 3D Sensors - South America Segment Research
11.4. South America Market Research (Market Size -$Million / $Billion)
11.4.1. Segment type Size and Market Size Analysis
11.4.2. Revenue and Trends
11.4.3. Application Revenue and Trends by type of Application
11.4.4. Company Revenue and Product Analysis
11.4.5. South America Product type and Application Market Size
11.4.5.1. Brazil
11.4.5.2. Venezuela
11.4.5.3. Argentina
11.4.5.4. Ecuador
11.4.5.5. Peru
11.4.5.6. Colombia
11.4.5.7. Costa Rica
11.4.5.8. Rest of South America
11.5. 3D Sensors - Europe Segment Research
11.6. Europe Market Research (Market Size -$Million / $Billion)
11.6.1. Segment type Size and Market Size Analysis
11.6.2. Revenue and Trends
11.6.3. Application Revenue and Trends by type of Application
11.6.4. Company Revenue and Product Analysis
11.6.5. Europe Segment Product type and Application Market Size
11.6.5.1. U.K
11.6.5.2. Germany
11.6.5.3. Italy
11.6.5.4. France
11.6.5.5. Netherlands
11.6.5.6. Belgium
11.6.5.7. Spain
11.6.5.8. Denmark
11.6.5.9. Rest of Europe
11.7. 3D Sensors – APAC Segment Research
11.8. APAC Market Research (Market Size -$Million / $Billion)
11.8.1. Segment type Size and Market Size Analysis
11.8.2. Revenue and Trends
11.8.3. Application Revenue and Trends by type of Application
11.8.4. Company Revenue and Product Analysis
11.8.5. APAC Segment – Product type and Application Market Size
11.8.5.1. China
11.8.5.2. Australia
11.8.5.3. Japan
11.8.5.4. South Korea
11.8.5.5. India
11.8.5.6. Taiwan
11.8.5.7. Malaysia
12. 3D Sensors Market - Entropy
12.1. New product launches
12.2. M&A's, collaborations, JVs and partnerships
13. 3D Sensors Market – Industry / Segment Competition landscape Premium
13.1. Market Share Analysis
13.1.1. Market Share by Country- Top companies
13.1.2. Market Share by Region- Top 10 companies
13.1.3. Market Share by type of Application – Top 10 companies
13.1.4. Market Share by type of Product / Product category- Top 10 companies
13.1.5. Market Share at global level- Top 10 companies
13.1.6. Best Practises for companies
14. 3D Sensors Market – Key Company List by Country Premium
15. 3D Sensors Market Company Analysis
15.1. Market Share, Company Revenue, Products, M&A, Developments
15.2. PMD technologies
15.3. Microchip Technologies
15.4. Movea SA
15.5. Omnivision
15.6. Pointgrab
15.7. Qualcomm Inc.
15.8. Reactrix
15.9. Samsung Electronics
15.10. Company 9
15.11. Company 10
15.12. Company 12 and more
"*Financials would be provided on a best efforts basis for private companies"
16. 3D Sensors Market - Appendix
16.1. Abbreviations
16.2. Sources
17. 3D Sensors Market - Methodology
17.1. Research Methodology
17.1.1. Company Expert Interviews
17.1.2. Industry Databases
17.1.3. Associations
17.1.4. Company News
17.1.5. Company Annual Reports
17.1.6. Application Trends
17.1.7. New Products and Product database
17.1.8. Company Transcripts
17.1.9. R&D Trends
17.1.10. Key Opinion Leaders Interviews
17.1.11. Supply and Demand Trends
List of Tables
Table1 3D Sensors Market Overview 2019-2024
Table2 3D Sensors Market Leader Analysis 2018-2019 (US$)
Table3 3D Sensors MarketProduct Analysis 2018-2019 (US$)
Table4 3D Sensors MarketEnd User Analysis 2018-2019 (US$)
Table5 3D Sensors MarketPatent Analysis 2013-2018* (US$)
Table6 3D Sensors MarketFinancial Analysis 2018-2019 (US$)
Table7 3D Sensors Market Driver Analysis 2018-2019 (US$)
Table8 3D Sensors MarketChallenges Analysis 2018-2019 (US$)
Table9 3D Sensors MarketConstraint Analysis 2018-2019 (US$)
Table10 3D Sensors Market Supplier Bargaining Power Analysis 2018-2019 (US$)
Table11 3D Sensors Market Buyer Bargaining Power Analysis 2018-2019 (US$)
Table12 3D Sensors Market Threat of Substitutes Analysis 2018-2019 (US$)
Table13 3D Sensors Market Threat of New Entrants Analysis 2018-2019 (US$)
Table14 3D Sensors Market Degree of Competition Analysis 2018-2019 (US$)
Table15 3D Sensors MarketValue Chain Analysis 2018-2019 (US$)
Table16 3D Sensors MarketPricing Analysis 2019-2024 (US$)
Table17 3D Sensors MarketOpportunities Analysis 2019-2024 (US$)
Table18 3D Sensors MarketProduct Life Cycle Analysis 2019-2024 (US$)
Table19 3D Sensors MarketSupplier Analysis 2018-2019 (US$)
Table20 3D Sensors MarketDistributor Analysis 2018-2019 (US$)
Table21 3D Sensors Market Trend Analysis 2018-2019 (US$)
Table22 3D Sensors Market Size 2018 (US$)
Table23 3D Sensors Market Forecast Analysis 2019-2024 (US$)
Table24 3D Sensors Market Sales Forecast Analysis 2019-2024 (Units)
Table25 3D Sensors Market, Revenue & Volume,By Technology, 2019-2024 ($)
Table26 3D Sensors MarketBy Technology, Revenue & Volume,By Interactive Displays, 2019-2024 ($)
Table27 3D Sensors MarketBy Technology, Revenue & Volume,By Capacitive Sensing, 2019-2024 ($)
Table28 3D Sensors MarketBy Technology, Revenue & Volume,By Infrared Sensing, 2019-2024 ($)
Table29 3D Sensors MarketBy Technology, Revenue & Volume,By Ultrasonic, 2019-2024 ($)
Table30 3D Sensors MarketBy Technology, Revenue & Volume,By Electric Field, 2019-2024 ($)
Table31 3D Sensors Market, Revenue & Volume,By End Use, 2019-2024 ($)
Table32 3D Sensors MarketBy End Use, Revenue & Volume,By Consumer Electronics, 2019-2024 ($)
Table33 3D Sensors MarketBy End Use, Revenue & Volume,By Wearable Devices, 2019-2024 ($)
Table34 3D Sensors MarketBy End Use, Revenue & Volume,By Automotive, 2019-2024 ($)
Table35 3D Sensors MarketBy End Use, Revenue & Volume,By Industrial Automation, 2019-2024 ($)
Table36 3D Sensors MarketBy End Use, Revenue & Volume,By Robotics, 2019-2024 ($)
Table37 North America 3D Sensors Market, Revenue & Volume,By Type, 2019-2024 ($)
Table38 North America 3D Sensors Market, Revenue & Volume,By Product, 2019-2024 ($)
Table39 North America 3D Sensors Market, Revenue & Volume,By Technology, 2019-2024 ($)
Table40 North America 3D Sensors Market, Revenue & Volume,By Application, 2019-2024 ($)
Table41 North America 3D Sensors Market, Revenue & Volume,By End Use, 2019-2024 ($)
Table42 South america 3D Sensors Market, Revenue & Volume,By Type, 2019-2024 ($)
Table43 South america 3D Sensors Market, Revenue & Volume,By Product, 2019-2024 ($)
Table44 South america 3D Sensors Market, Revenue & Volume,By Technology, 2019-2024 ($)
Table45 South america 3D Sensors Market, Revenue & Volume,By Application, 2019-2024 ($)
Table46 South america 3D Sensors Market, Revenue & Volume,By End Use, 2019-2024 ($)
Table47 Europe 3D Sensors Market, Revenue & Volume,By Type, 2019-2024 ($)
Table48 Europe 3D Sensors Market, Revenue & Volume,By Product, 2019-2024 ($)
Table49 Europe 3D Sensors Market, Revenue & Volume,By Technology, 2019-2024 ($)
Table50 Europe 3D Sensors Market, Revenue & Volume,By Application, 2019-2024 ($)
Table51 Europe 3D Sensors Market, Revenue & Volume,By End Use, 2019-2024 ($)
Table52 APAC 3D Sensors Market, Revenue & Volume,By Type, 2019-2024 ($)
Table53 APAC 3D Sensors Market, Revenue & Volume,By Product, 2019-2024 ($)
Table54 APAC 3D Sensors Market, Revenue & Volume,By Technology, 2019-2024 ($)
Table55 APAC 3D Sensors Market, Revenue & Volume,By Application, 2019-2024 ($)
Table56 APAC 3D Sensors Market, Revenue & Volume,By End Use, 2019-2024 ($)
Table57 Middle East & Africa 3D Sensors Market, Revenue & Volume,By Type, 2019-2024 ($)
Table58 Middle East & Africa 3D Sensors Market, Revenue & Volume,By Product, 2019-2024 ($)
Table59 Middle East & Africa 3D Sensors Market, Revenue & Volume,By Technology, 2019-2024 ($)
Table60 Middle East & Africa 3D Sensors Market, Revenue & Volume,By Application, 2019-2024 ($)
Table61 Middle East & Africa 3D Sensors Market, Revenue & Volume,By End Use, 2019-2024 ($)
Table62 Russia 3D Sensors Market, Revenue & Volume,By Type, 2019-2024 ($)
Table63 Russia 3D Sensors Market, Revenue & Volume,By Product, 2019-2024 ($)
Table64 Russia 3D Sensors Market, Revenue & Volume,By Technology, 2019-2024 ($)
Table65 Russia 3D Sensors Market, Revenue & Volume,By Application, 2019-2024 ($)
Table66 Russia 3D Sensors Market, Revenue & Volume,By End Use, 2019-2024 ($)
Table67 Israel 3D Sensors Market, Revenue & Volume,By Type, 2019-2024 ($)
Table68 Israel 3D Sensors Market, Revenue & Volume,By Product, 2019-2024 ($)
Table69 Israel 3D Sensors Market, Revenue & Volume,By Technology, 2019-2024 ($)
Table70 Israel 3D Sensors Market, Revenue & Volume,By Application, 2019-2024 ($)
Table71 Israel 3D Sensors Market, Revenue & Volume,By End Use, 2019-2024 ($)
Table72 Top Companies 2018 (US$)3D Sensors Market, Revenue & Volume,,
Table73 Product Launch 2018-20193D Sensors Market, Revenue & Volume,,
List of Figures
Figure 1 Overview of 3D Sensors Market 2019-2024
Figure 2 Market Share Analysis for 3D Sensors Market 2018 (US$)
Figure 3 Product Comparison in 3D Sensors Market 2018-2019 (US$)
Figure 4 End User Profile for 3D Sensors Market 2018-2019 (US$)
Figure 5 Patent Application and Grant in 3D Sensors Market 2013-2018* (US$)
Figure 6 Top 5 Companies Financial Analysis in 3D Sensors Market 2018-2019 (US$)
Figure 7 Market Entry Strategy in 3D Sensors Market 2018-2019
Figure 8 Ecosystem Analysis in 3D Sensors Market2018
Figure 9 Average Selling Price in 3D Sensors Market 2019-2024
Figure 10 Top Opportunites in 3D Sensors Market 2018-2019
Figure 11 Market Life Cycle Analysis in 3D Sensors Market
Figure 12 GlobalBy Technology3D Sensors Market Revenue, 2019-2024 ($)
Figure 13 GlobalBy End Use3D Sensors Market Revenue, 2019-2024 ($)
Figure 14 Global 3D Sensors Market - By Geography
Figure 15 Global 3D Sensors Market Value & Volume, By Geography, 2019-2024 ($)
Figure 16 Global 3D Sensors Market CAGR, By Geography, 2019-2024 (%)
Figure 17 North America 3D Sensors Market Value & Volume, 2019-2024 ($)
Figure 18 US 3D Sensors Market Value & Volume, 2019-2024 ($)
Figure 19 US GDP and Population, 2018-2019 ($)
Figure 20 US GDP – Composition of 2018, By Sector of Origin
Figure 21 US Export and Import Value & Volume, 2018-2019 ($)
Figure 22 Canada 3D Sensors Market Value & Volume, 2019-2024 ($)
Figure 23 Canada GDP and Population, 2018-2019 ($)
Figure 24 Canada GDP – Composition of 2018, By Sector of Origin
Figure 25 Canada Export and Import Value & Volume, 2018-2019 ($)
Figure 26 Mexico 3D Sensors Market Value & Volume, 2019-2024 ($)
Figure 27 Mexico GDP and Population, 2018-2019 ($)
Figure 28 Mexico GDP – Composition of 2018, By Sector of Origin
Figure 29 Mexico Export and Import Value & Volume, 2018-2019 ($)
Figure 30 South America 3D Sensors MarketSouth America 3D Printing Market Value & Volume, 2019-2024 ($)
Figure 31 Brazil 3D Sensors Market Value & Volume, 2019-2024 ($)
Figure 32 Brazil GDP and Population, 2018-2019 ($)
Figure 33 Brazil GDP – Composition of 2018, By Sector of Origin
Figure 34 Brazil Export and Import Value & Volume, 2018-2019 ($)
Figure 35 Venezuela 3D Sensors Market Value & Volume, 2019-2024 ($)
Figure 36 Venezuela GDP and Population, 2018-2019 ($)
Figure 37 Venezuela GDP – Composition of 2018, By Sector of Origin
Figure 38 Venezuela Export and Import Value & Volume, 2018-2019 ($)
Figure 39 Argentina 3D Sensors Market Value & Volume, 2019-2024 ($)
Figure 40 Argentina GDP and Population, 2018-2019 ($)
Figure 41 Argentina GDP – Composition of 2018, By Sector of Origin
Figure 42 Argentina Export and Import Value & Volume, 2018-2019 ($)
Figure 43 Ecuador 3D Sensors Market Value & Volume, 2019-2024 ($)
Figure 44 Ecuador GDP and Population, 2018-2019 ($)
Figure 45 Ecuador GDP – Composition of 2018, By Sector of Origin
Figure 46 Ecuador Export and Import Value & Volume, 2018-2019 ($)
Figure 47 Peru 3D Sensors Market Value & Volume, 2019-2024 ($)
Figure 48 Peru GDP and Population, 2018-2019 ($)
Figure 49 Peru GDP – Composition of 2018, By Sector of Origin
Figure 50 Peru Export and Import Value & Volume, 2018-2019 ($)
Figure 51 Colombia 3D Sensors Market Value & Volume, 2019-2024 ($)
Figure 52 Colombia GDP and Population, 2018-2019 ($)
Figure 53 Colombia GDP – Composition of 2018, By Sector of Origin
Figure 54 Colombia Export and Import Value & Volume, 2018-2019 ($)
Figure 55 Costa Rica 3D Sensors MarketCosta Rica 3D Printing Market Value & Volume, 2019-2024 ($)
Figure 56 Costa Rica GDP and Population, 2018-2019 ($)
Figure 57 Costa Rica GDP – Composition of 2018, By Sector of Origin
Figure 58 Costa Rica Export and Import Value & Volume, 2018-2019 ($)
Figure 59 Europe 3D Sensors Market Value & Volume, 2019-2024 ($)
Figure 60 U.K 3D Sensors Market Value & Volume, 2019-2024 ($)
Figure 61 U.K GDP and Population, 2018-2019 ($)
Figure 62 U.K GDP – Composition of 2018, By Sector of Origin
Figure 63 U.K Export and Import Value & Volume, 2018-2019 ($)
Figure 64 Germany 3D Sensors Market Value & Volume, 2019-2024 ($)
Figure 65 Germany GDP and Population, 2018-2019 ($)
Figure 66 Germany GDP – Composition of 2018, By Sector of Origin
Figure 67 Germany Export and Import Value & Volume, 2018-2019 ($)
Figure 68 Italy 3D Sensors Market Value & Volume, 2019-2024 ($)
Figure 69 Italy GDP and Population, 2018-2019 ($)
Figure 70 Italy GDP – Composition of 2018, By Sector of Origin
Figure 71 Italy Export and Import Value & Volume, 2018-2019 ($)
Figure 72 France 3D Sensors Market Value & Volume, 2019-2024 ($)
Figure 73 France GDP and Population, 2018-2019 ($)
Figure 74 France GDP – Composition of 2018, By Sector of Origin
Figure 75 France Export and Import Value & Volume, 2018-2019 ($)
Figure 76 Netherlands 3D Sensors Market Value & Volume, 2019-2024 ($)
Figure 77 Netherlands GDP and Population, 2018-2019 ($)
Figure 78 Netherlands GDP – Composition of 2018, By Sector of Origin
Figure 79 Netherlands Export and Import Value & Volume, 2018-2019 ($)
Figure 80 Belgium 3D Sensors Market Value & Volume, 2019-2024 ($)
Figure 81 Belgium GDP and Population, 2018-2019 ($)
Figure 82 Belgium GDP – Composition of 2018, By Sector of Origin
Figure 83 Belgium Export and Import Value & Volume, 2018-2019 ($)
Figure 84 Spain 3D Sensors Market Value & Volume, 2019-2024 ($)
Figure 85 Spain GDP and Population, 2018-2019 ($)
Figure 86 Spain GDP – Composition of 2018, By Sector of Origin
Figure 87 Spain Export and Import Value & Volume, 2018-2019 ($)
Figure 88 Denmark 3D Sensors Market Value & Volume, 2019-2024 ($)
Figure 89 Denmark GDP and Population, 2018-2019 ($)
Figure 90 Denmark GDP – Composition of 2018, By Sector of Origin
Figure 91 Denmark Export and Import Value & Volume, 2018-2019 ($)
Figure 92 APAC 3D Sensors Market Value & Volume, 2019-2024 ($)
Figure 93 China 3D Sensors MarketValue & Volume, 2019-2024
Figure 94 China GDP and Population, 2018-2019 ($)
Figure 95 China GDP – Composition of 2018, By Sector of Origin
Figure 96 China Export and Import Value & Volume, 2018-2019 ($)3D Sensors MarketChina Export and Import Value & Volume, 2018-2019 ($)
Figure 97 Australia 3D Sensors Market Value & Volume, 2019-2024 ($)
Figure 98 Australia GDP and Population, 2018-2019 ($)
Figure 99 Australia GDP – Composition of 2018, By Sector of Origin
Figure 100 Australia Export and Import Value & Volume, 2018-2019 ($)
Figure 101 South Korea 3D Sensors Market Value & Volume, 2019-2024 ($)
Figure 102 South Korea GDP and Population, 2018-2019 ($)
Figure 103 South Korea GDP – Composition of 2018, By Sector of Origin
Figure 104 South Korea Export and Import Value & Volume, 2018-2019 ($)
Figure 105 India 3D Sensors Market Value & Volume, 2019-2024 ($)
Figure 106 India GDP and Population, 2018-2019 ($)
Figure 107 India GDP – Composition of 2018, By Sector of Origin
Figure 108 India Export and Import Value & Volume, 2018-2019 ($)
Figure 109 Taiwan 3D Sensors MarketTaiwan 3D Printing Market Value & Volume, 2019-2024 ($)
Figure 110 Taiwan GDP and Population, 2018-2019 ($)
Figure 111 Taiwan GDP – Composition of 2018, By Sector of Origin
Figure 112 Taiwan Export and Import Value & Volume, 2018-2019 ($)
Figure 113 Malaysia 3D Sensors MarketMalaysia 3D Printing Market Value & Volume, 2019-2024 ($)
Figure 114 Malaysia GDP and Population, 2018-2019 ($)
Figure 115 Malaysia GDP – Composition of 2018, By Sector of Origin
Figure 116 Malaysia Export and Import Value & Volume, 2018-2019 ($)
Figure 117 Hong Kong 3D Sensors MarketHong Kong 3D Printing Market Value & Volume, 2019-2024 ($)
Figure 118 Hong Kong GDP and Population, 2018-2019 ($)
Figure 119 Hong Kong GDP – Composition of 2018, By Sector of Origin
Figure 120 Hong Kong Export and Import Value & Volume, 2018-2019 ($)
Figure 121 Middle East & Africa 3D Sensors MarketMiddle East & Africa 3D Printing Market Value & Volume, 2019-2024 ($)
Figure 122 Russia 3D Sensors MarketRussia 3D Printing Market Value & Volume, 2019-2024 ($)
Figure 123 Russia GDP and Population, 2018-2019 ($)
Figure 124 Russia GDP – Composition of 2018, By Sector of Origin
Figure 125 Russia Export and Import Value & Volume, 2018-2019 ($)
Figure 126 Israel 3D Sensors Market Value & Volume, 2019-2024 ($)
Figure 127 Israel GDP and Population, 2018-2019 ($)
Figure 128 Israel GDP – Composition of 2018, By Sector of Origin
Figure 129 Israel Export and Import Value & Volume, 2018-2019 ($)
Figure 130 Entropy Share, By Strategies, 2018-2019* (%)3D Sensors Market
Figure 131 Developments, 2018-2019*3D Sensors Market
Figure 132 Company 1 3D Sensors Market Net Revenue, By Years, 2018-2019* ($)
Figure 133 Company 1 3D Sensors Market Net Revenue Share, By Business segments, 2018 (%)
Figure 134 Company 1 3D Sensors Market Net Sales Share, By Geography, 2018 (%)
Figure 135 Company 2 3D Sensors Market Net Revenue, By Years, 2018-2019* ($)
Figure 136 Company 2 3D Sensors Market Net Revenue Share, By Business segments, 2018 (%)
Figure 137 Company 2 3D Sensors Market Net Sales Share, By Geography, 2018 (%)
Figure 138 Company 33D Sensors Market Net Revenue, By Years, 2018-2019* ($)
Figure 139 Company 33D Sensors Market Net Revenue Share, By Business segments, 2018 (%)
Figure 140 Company 33D Sensors Market Net Sales Share, By Geography, 2018 (%)
Figure 141 Company 4 3D Sensors Market Net Revenue, By Years, 2018-2019* ($)
Figure 142 Company 4 3D Sensors Market Net Revenue Share, By Business segments, 2018 (%)
Figure 143 Company 4 3D Sensors Market Net Sales Share, By Geography, 2018 (%)
Figure 144 Company 5 3D Sensors Market Net Revenue, By Years, 2018-2019* ($)
Figure 145 Company 5 3D Sensors Market Net Revenue Share, By Business segments, 2018 (%)
Figure 146 Company 5 3D Sensors Market Net Sales Share, By Geography, 2018 (%)
Figure 147 Company 6 3D Sensors Market Net Revenue, By Years, 2018-2019* ($)
Figure 148 Company 6 3D Sensors Market Net Revenue Share, By Business segments, 2018 (%)
Figure 149 Company 6 3D Sensors Market Net Sales Share, By Geography, 2018 (%)
Figure 150 Company 7 3D Sensors Market Net Revenue, By Years, 2018-2019* ($)
Figure 151 Company 7 3D Sensors Market Net Revenue Share, By Business segments, 2018 (%)
Figure 152 Company 7 3D Sensors Market Net Sales Share, By Geography, 2018 (%)
Figure 153 Company 8 3D Sensors Market Net Revenue, By Years, 2018-2019* ($)
Figure 154 Company 8 3D Sensors Market Net Revenue Share, By Business segments, 2018 (%)
Figure 155 Company 8 3D Sensors Market Net Sales Share, By Geography, 2018 (%)
Figure 156 Company 9 3D Sensors Market Net Revenue, By Years, 2018-2019* ($)
Figure 157 Company 9 3D Sensors Market Net Revenue Share, By Business segments, 2018 (%)
Figure 158 Company 9 3D Sensors Market Net Sales Share, By Geography, 2018 (%)
Figure 159 Company 10 3D Sensors Market Net Revenue, By Years, 2018-2019* ($)
Figure 160 Company 10 3D Sensors Market Net Revenue Share, By Business segments, 2018 (%)
Figure 161 Company 10 3D Sensors Market Net Sales Share, By Geography, 2018 (%)
Figure 162 Company 11 3D Sensors Market Net Revenue, By Years, 2018-2019* ($)
Figure 163 Company 11 3D Sensors Market Net Revenue Share, By Business segments, 2018 (%)
Figure 164 Company 11 3D Sensors Market Net Sales Share, By Geography, 2018 (%)
Figure 165 Company 12 3D Sensors Market Net Revenue, By Years, 2018-2019* ($)
Figure 166 Company 12 3D Sensors Market Net Revenue Share, By Business segments, 2018 (%)
Figure 167 Company 12 3D Sensors Market Net Sales Share, By Geography, 2018 (%)
Figure 168 Company 133D Sensors Market Net Revenue, By Years, 2018-2019* ($)
Figure 169 Company 133D Sensors Market Net Revenue Share, By Business segments, 2018 (%)
Figure 170 Company 133D Sensors Market Net Sales Share, By Geography, 2018 (%)
Figure 171 Company 14 3D Sensors Market Net Revenue, By Years, 2018-2019* ($)
Figure 172 Company 14 3D Sensors Market Net Revenue Share, By Business segments, 2018 (%)
Figure 173 Company 14 3D Sensors Market Net Sales Share, By Geography, 2018 (%)
Figure 174 Company 15 3D Sensors Market Net Revenue, By Years, 2018-2019* ($)
Figure 175 Company 15 3D Sensors Market Net Revenue Share, By Business segments, 2018 (%)
Figure 176 Company 15 3D Sensors Market Net Sales Share, By Geography, 2018 (%)