 이메일
이메일 인쇄
인쇄


Farm Equipment Market Overview:
Farm equipment covers an extensive range of equipment engaged at several stages of agriculture such as land development, sowing, planting, cultivation, harvesting, and threshing. The range varies from simplest tools such as hand trowel to fertilizers, plow, harrow, fertilizer spreader, seeder and high-end engineered tractors. The World Bank has estimated that the demand for food will upsurge by 70% by 2050 and $80 billion annual investment will be required to meet the objectives. Such alarming ultimatum calls for efficient farming techniques and hence advanced farm equipment are the catch and have the potential to divert mandatory investments into its own pocket.
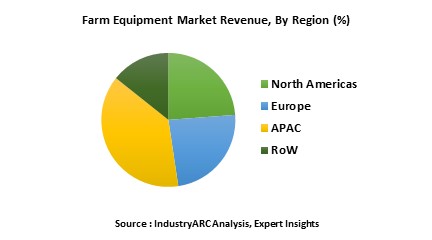
As per the market outlook foreseen by a recent IndustryARC business intelligence report, the farm equipment market size ranges from $170 billion to $175 billion and is forecast to grow at a global CAGR of around 6% going through 2025. Farm equipment are a global phenomenon but APAC is the fastest growing regional market with a global CAGR of 40% - 45% which is mainly attributed to the impeccable agricultural lands and market of India and China. FICCI (Federation of Indian Chambers of Commerce & Industry) stated that Indian agriculture sector contributes approximately 14% to India’s GDP. And Organisation for Economic Co-operation and Development revealed that China has 21% of global population in its territory along with 9% of universal arable land.
Farm Equipment Market Outlook:
Farm equipment market in this report has been segmented into different phases accumulating the over-all agricultural production from land development to harvesting and threshing. The agricultural equipment involved at different stages are tractors, fertilizing, plant protection equipment, harvesting equipment, irrigation equipment, hay and forage equipment, crop processing equipment, seeding equipment, grain handling equipment, cutters, shredders and sprayers. As of 2018, irrigation machinery leads the application segment covering nearly 10% of the entire global farm equipment marketplace owing to harsh topography and weather conditions prevailing in majority of developing countries constituting a major chunk of global population dependent on agriculture. Efficient irrigation facilities empower the agro-economy by contravention of constraints such as deficient water supply. Drip irrigation systems save water and nutrients by enabling water to drip slowly to the roots of the plants and minimize evaporation. A classic example can be derived from a World Bank data which states that the Peru Sierra Irrigation Subsector Project made a substantial impact in increasing agricultural production and productivity ranging between 118 percent and 170 percent in targeted areas of the Peruvian Sierra.
Farm Equipment Market Growth Drivers:
Farm Equipment market is not solely dependent on the agricultural industry. Some of the other factors indirectly but positively influencing the market are financing equipment such as agriculture finance and agriculture insurance initiated by governmental and non-governmental organizations. The World Bank Group is a leading global financier of agriculture, with $6.8 billion in new IBRD/IDA commitments in 2018.
In the recent years, the world has witnessed unprecedented demand from the robustly growing F&B sector owing to rapidly increasing world population. Traditional farming techniques are time consuming and less economical in terms of labor costs, and global reduction in farming lands further adds to the dilemma. To combat and deliver under such crucial circumstances, employment of farm equipment by agricultural sector is inevitable. For example- The World Bank preceding statistics reveals that an outstanding 25,054,140 tractors were already globally employed as of January 2019 and with the advent of machineries practices in agro sector along with improved financial aids, the deployment is going to be at a more dynamic scale affecting the global farm equipment market.
Farm Equipment Market Challenges:
Two of the major challenges surfacing this flourishing and imperative domain are financial aspects such as capital and rate of interest and unskilled agronomic man force. But it is also to be noted that the financial aspects are being slowly countered by various organizations and bodies providing low-interest loans, zero to low-interest credits, and grants to developing countries for agricultural operations. To skill the agronomic man force for utility of farm equipment which will automatically consequence in efficient production, various countries has come up with machineries institutes and e-farming portals. A sheer example from the often recalled as land of agriculture, India, is the Central Farm Machinery Training & Testing Institute, Budni (M.P.).
Farm Equipment Market Key Players Perspective:
Some of the key players mentioned in the report are AGCO, John Deere, CLAAS, Massey Ferguson, Argo Group, Mahindra and Mahindra, Hunter Industries, Toro Corp., Jain Irrigation, Bucher Industries, CNH Industrial, Kvernerland Group, SDF Group, Kubota, Lindsay Corp.
John Deere, an American giant commemorated the production of its 5,000th Forestry Swing Machine, a 2656G Log Loader in January 2019. The company was among the first to introduce electric drive technology in off-highway equipment and their 644K and 944K Hybrid Wheel Loaders have collectively logged more than 1 million operating hours in the field.
Farm Equipment Market Trends:
Supporting Events:
The Irish Farm Tractor & Machinery Trade Association hosted the biggest ever ‘The FTMTA Farm Machinery Show,’ on February 7th, 8th and 9th 2019. 160 national and international machineries manufacturers and distributors were stationed to meet their potential customers and take the farm equipment market ahead of the curve.
Promising Acquisitions:
AGCO, which comprises Massey Ferguson, Fendt, Valtra and other farm machinery brand-names, accounted for revenues approaching $10 billion in 2018. AGCO merging with Fendt, has embarked upon several milestones. A recent example is towed plant protection sprayer, Fendt Rogator 300, and the self-driving Fendt Rogator 600 marking their sale of 100 units. AGCO Corporation received seven AE50 Awards from the American Society of Agricultural and Biological Engineers (ASABE) in 2019 and AGCO/Fendt wins the AE50 Award in US for best new Fendt IDEAL large combine.
Farm Equipment Market Research Scope:
The base year of the study is 2018, with forecast done up to 2025. The study presents a thorough analysis of the competitive landscape, taking into account the market shares of the leading companies. It also provides information on unit shipments. These provide the key market participants with the necessary business intelligence and help them understand the future of the farm equipment market. The assessment includes the forecast, an overview of the competitive structure, the market shares of the competitors, as well as the market trends, market demands, market drivers, market challenges, and product analysis. The market drivers and restraints have been assessed to fathom their impact over the forecast period. This report further identifies the key opportunities for growth while also detailing the key challenges and possible threats. The key areas of focus include the types of equipment in the farm equipment market, and their specific applications in different phases of agricultural production.
Farm Equipment Market Report: Industry Coverage
Types of Equipment in Farm Equipment Market:
By Application- Agri Equipment, Construction Equipment, Chemical Applications, Financing Equipment, Material Handling Equipment, Snow Removal Equipment, Property Maintenance Equipment.
By Machinery- Tractors, Fertilizing, Plant Protection Equipment, Harvesting Equipment, Irrigation Equipment, Hay and Forage Equipment, Crop processing Equipment, Seeding Equipment, Grain Handling Equipment, Cutters, Shredders and Sprayers
By Agricultural Phase- Land Development, Sowing, Planting, Cultivation, Harvesting, and Threshing.
The Farm Equipment Market report also analyzes the major geographic regions for the market as well as the major countries for the market in these regions. The regions and countries covered in the study include:
- North America: The U.S., Canada, Mexico
- South America: Brazil, Venezuela, Argentina, Ecuador, Peru, Colombia, Costa Rica
- Europe: The U.K., Germany, Italy, France, The Netherlands, Belgium, Spain, Denmark
- APAC: China, Japan, Australia, South Korea, India, Taiwan, Malaysia, Hong Kong
- Middle East and Africa: Israel, South Africa, Saudi Arabia
1. Farm Equipment Market - Overview
1.1. Definitions and Scope
2. Farm Equipment Market - Executive summary
2.1. Market Revenue, Market Size and Key Trends by Company
2.2. Key Trends by type of Application
2.3. Key Trends segmented by Geography
3. Farm Equipment Market
3.1. Comparative analysis
3.1.1. Product Benchmarking - Top 10 companies
3.1.2. Top 5 Financials Analysis
3.1.3. Market Value split by Top 10 companies
3.1.4. Patent Analysis - Top 10 companies
3.1.5. Pricing Analysis
4. Farm Equipment Market – Startup companies Scenario Premium
4.1. Top 10 startup company Analysis by
4.1.1. Investment
4.1.2. Revenue
4.1.3. Market Shares
4.1.4. Market Size and Application Analysis
4.1.5. Venture Capital and Funding Scenario
5. Farm Equipment Market – Industry Market Entry Scenario Premium
5.1. Regulatory Framework Overview
5.2. New Business and Ease of Doing business index
5.3. Case studies of successful ventures
5.4. Customer Analysis – Top 10 companies
6. Farm Equipment Market Forces
6.1. Drivers
6.2. Constraints
6.3. Challenges
6.4. Porters five force model
6.4.1. Bargaining power of suppliers
6.4.2. Bargaining powers of customers
6.4.3. Threat of new entrants
6.4.4. Rivalry among existing players
6.4.5. Threat of substitutes
7. Farm Equipment Market - Strategic analysis
7.1. Value chain analysis
7.2. Opportunities analysis
7.3. Product life cycle
7.4. Suppliers and distributors Market Share
8. Farm Equipment Market – Government Regulations and Support
9. Farm Equipment Market – By Type (Market Size -$Million / $Billion)
9.1. Market Size and Market Share Analysis
9.2. Application Revenue and Trend Research
9.3. Product Segment Analysis
9.3.1. Introduction
9.3.1.1. <22 HP
9.3.1.2. 22.1 to 100 HP
9.3.1.3. 100 to 200 HP
9.3.1.4. 201 to 300 HP
9.3.1.5. 301 to 400 HP
9.3.1.6. Above 400 HP
9.3.2. Trailers and Trucks
9.3.3. Tractors
9.3.4. Tillage Equipment
9.3.4.1. Primary Tillage Equipment
9.3.4.1.1. Rotary Tillers
9.3.4.1.2. Disc Tiller Plough
9.3.4.1.3. Sub Soil Plough
9.3.4.1.4. Disc Plough
9.3.4.1.5. Moldboard Plough
9.3.4.1.6. Others
9.3.4.2. Secondary Tillage Equipment
9.3.4.2.1. Pulverizers
9.3.4.2.2. Cultivators
9.3.4.2.3. Weeders
9.3.4.2.4. Harrows
9.3.4.2.4.1. Off set Disc Harrow
9.3.4.2.4.2. Disc Harrow
9.3.5. Planting Equipment
9.3.5.1. Seed Drills
9.3.5.2. Air Seeders
9.3.5.3. Transplanters
9.3.5.4. Planters
9.3.5.4.1. Regular Drill Planter
9.3.5.4.2. Check-Row Planter
9.3.5.4.3. Hill Drop Planter
9.3.5.5. Broadcast Seeders
9.3.5.6. Box Drill Seeders
9.3.6. Irrigation Equipment
9.3.6.1. Pumps
9.3.6.2. Filters
9.3.6.3. Pipes
9.3.6.4. Valves
9.3.6.5. Emitters
9.3.6.5.1. Inline
9.3.6.5.2. Online
9.3.7. Harvesting Equipment
9.3.7.1.Combine Harvesters
9.3.7.1.1. Self-Propelled
9.3.7.1.2. Tractor Pulled
9.3.7.1.3. PTO Powered
9.3.7.1.4. Others
9.3.7.2.Threshers
9.3.7.2.1. Multi-Crop Thresher
9.3.7.2.2. Axial-Flow Paddy Thresher
9.3.7.2.3. Pedal Operated Paddy Thresher
9.3.7.2.4. Sheller
9.3.7.2.4.1. Spike Tooth Type
9.3.7.2.4.2. Axial Flow Type
9.3.7.3. Others
9.3.8. Hay and Forage Equipment
9.3.8.1. Mowers
9.3.8.2. Balers
9.3.8.3. Forage Blowers
9.3.8.4. Others
9.3.9. Crop Processing Equipment
9.3.10. Plant Protection Equipment
9.3.10.1. Hand Operated Sprayers
9.3.10.2. Motorized Sprayers
9.3.10.3. Boom Sprayers
9.3.10.4. Airblast Sprayers
9.3.10.5. Aerial Sprayer
9.3.10.6. Others
9.3.11. Sprinkler Irrigation Equipment
9.3.11.1. Center Pivot
9.3.11.2. Lateral Move
9.3.11.3. Solid Set
9.3.11.4. Travelling Guns
9.3.11.5. Side Roll
9.3.11.6. Others
9.3.12. Others
10. Farm Equipment Market – By Phase (Market Size -$Million / $Billion)
10.1. Introduction
10.2. Land Development
10.3. Sowing and Planting
10.4. Cultivation
10.5. Harvesting and Threshing
10.6. Post Harvesting
10.7. Others
11. Farm Equipment - By Geography (Market Size -$Million / $Billion)
11.1. Farm Equipment Market - North America Segment Research
11.2. North America Market Research (Million / $Billion)
11.2.1. Segment type Size and Market Size Analysis
11.2.2. Revenue and Trends
11.2.3. Application Revenue and Trends by type of Application
11.2.4. Company Revenue and Product Analysis
11.2.5. North America Product type and Application Market Size
11.2.5.1. U.S.
11.2.5.2. Canada
11.2.5.3. Mexico
11.2.5.4. Rest of North America
11.3. Farm Equipment - South America Segment Research
11.4. South America Market Research (Market Size -$Million / $Billion)
11.4.1. Segment type Size and Market Size Analysis
11.4.2. Revenue and Trends
11.4.3. Application Revenue and Trends by type of Application
11.4.4. Company Revenue and Product Analysis
11.4.5. South America Product type and Application Market Size
11.4.5.1. Brazil
11.4.5.2. Venezuela
11.4.5.3. Argentina
11.4.5.4. Ecuador
11.4.5.5. Peru
11.4.5.6. Colombia
11.4.5.7. Costa Rica
11.4.5.8. Rest of South America
11.5. Farm Equipment - Europe Segment Research
11.6. Europe Market Research (Market Size -$Million / $Billion)
11.6.1. Segment type Size and Market Size Analysis
11.6.2. Revenue and Trends
11.6.3. Application Revenue and Trends by type of Application
11.6.4. Company Revenue and Product Analysis
11.6.5. Europe Segment Product type and Application Market Size
11.6.5.1. U.K
11.6.5.2. Germany
11.6.5.3. Italy
11.6.5.4. France
11.6.5.5. Netherlands
11.6.5.6. Belgium
11.6.5.7. Spain
11.6.5.8. Denmark
11.6.5.9. Rest of Europe
11.7. Farm Equipment – APAC Segment Research
11.8. APAC Market Research (Market Size -$Million / $Billion)
11.8.1. Segment type Size and Market Size Analysis
11.8.2. Revenue and Trends
11.8.3. Application Revenue and Trends by type of Application
11.8.4. Company Revenue and Product Analysis
11.8.5. APAC Segment – Product type and Application Market Size
11.8.5.1. China
11.8.5.2. Australia
11.8.5.3. Japan
11.8.5.4. South Korea
11.8.5.5. India
11.8.5.6. Taiwan
11.8.5.7. Malaysia
12. Farm Equipment Market - Entropy
12.1. New product launches
12.2. M&A's, collaborations, JVs and partnerships
13. Farm Equipment Market – Industry / Segment Competition landscape Premium
13.1. Market Share Analysis
13.1.1. Market Share by Country- Top companies
13.1.2. Market Share by Region- Top 10 companies
13.1.3. Market Share by type of Application – Top 10 companies
13.1.4. Market Share by type of Product / Product category- Top 10 companies
13.1.5. Market Share at global level- Top 10 companies
13.1.6. Best Practises for companies
14. Farm Equipment Market – Key Company List by Country Premium
15. Farm Equipment Market Company Analysis
15.1. Market Share, Company Revenue, Products, M&A, Developments
15.2. Alamo Group Inc.
15.3. Agco Corporation
15.4. Argo S. p. A
15.5. Amazone H. Dreyer GmbH & Co. KG
15.6. Bucher Industries
15.7. Class KGaA mbH
15.8. CNH Industrial N.V.
15.9. Daedong Industrial Company Ltd.
15.10. Deere & Company
15.11. Escorts Group
15.12. Company 11
15.13. Company 12
15.14. Company 13 and more
"*Financials would be provided on a best efforts basis for private companies"
16. Farm Equipment Market - Appendix
16.1. Abbreviations
16.2. Sources
17. Farm Equipment Market - Methodology
17.1. Research Methodology
17.1.1. Company Expert Interviews
17.1.2. Industry Databases
17.1.3. Associations
17.1.4. Company News
17.1.5. Company Annual Reports
17.1.6. Application Trends
17.1.7. New Products and Product database
17.1.8. Company Transcripts
17.1.9. R&D Trends
17.1.10. Key Opinion Leaders Interviews
17.1.11. Supply and Demand Trends
List of Tables:
Table 1: Farm Equipment Market Overview 2019-2024
Table 2: Farm Equipment Market Leader Analysis 2018-2019 (US$)
Table 3: Farm Equipment Market Product Analysis 2018-2019 (US$)
Table 4: Farm Equipment Market End User Analysis 2018-2019 (US$)
Table 5: Farm Equipment Market Patent Analysis 2013-2018* (US$)
Table 6: Farm Equipment Market Financial Analysis 2018-2019 (US$)
Table 7: Farm Equipment Market Driver Analysis 2018-2019 (US$)
Table 8: Farm Equipment Market Challenges Analysis 2018-2019 (US$)
Table 9: Farm Equipment Market Constraint Analysis 2018-2019 (US$)
Table 10: Farm Equipment Market Supplier Bargaining Power Analysis 2018-2019 (US$)
Table 11: Farm Equipment Market Buyer Bargaining Power Analysis 2018-2019 (US$)
Table 12: Farm Equipment Market Threat of Substitutes Analysis 2018-2019 (US$)
Table 13: Farm Equipment Market Threat of New Entrants Analysis 2018-2019 (US$)
Table 14: Farm Equipment Market Degree of Competition Analysis 2018-2019 (US$)
Table 15: Farm Equipment Market Value Chain Analysis 2018-2019 (US$)
Table 16: Farm Equipment Market Pricing Analysis 2019-2024 (US$)
Table 17: Farm Equipment Market Opportunities Analysis 2019-2024 (US$)
Table 18: Farm Equipment Market Product Life Cycle Analysis 2019-2024 (US$)
Table 19: Farm Equipment Market Supplier Analysis 2018-2019 (US$)
Table 20: Farm Equipment Market Distributor Analysis 2018-2019 (US$)
Table 21: Farm Equipment Market Trend Analysis 2018-2019 (US$)
Table 22: Farm Equipment Market Size 2018 (US$)
Table 23: Farm Equipment Market Forecast Analysis 2019-2024 (US$)
Table 24: Farm Equipment Market Sales Forecast Analysis 2019-2024 (Units)
Table 25: Farm Equipment Market, Revenue & Volume, By Type, 2019-2024 ($)
Table 26: Farm Equipment Market By Type, Revenue & Volume, By Trailers and Trucks, 2019-2024 ($)
Table 27: Farm Equipment Market By Type, Revenue & Volume, By Tractors, 2019-2024 ($)
Table 28: Farm Equipment Market By Type, Revenue & Volume, By Tillage Equipment, 2019-2024 ($)
Table 29: Farm Equipment Market By Type, Revenue & Volume, By Planting Equipment, 2019-2024 ($)
Table 30: Farm Equipment Market By Type, Revenue & Volume, By Irrigation Equipment, 2019-2024 ($)
Table 31: Farm Equipment Market, Revenue & Volume, By Phase, 2019-2024 ($)
Table 32: Farm Equipment Market By Phase, Revenue & Volume, By Land Development, 2019-2024 ($)
Table 33: Farm Equipment Market By Phase, Revenue & Volume, By Sowing and Planting, 2019-2024 ($)
Table 34: Farm Equipment Market By Phase, Revenue & Volume, By Cultivation, 2019-2024 ($)
Table 35: Farm Equipment Market By Phase, Revenue & Volume, By Harvesting and Threshing, 2019-2024 ($)
Table 36: Farm Equipment Market By Phase, Revenue & Volume, By Post Harvesting, 2019-2024 ($)
Table 37: North America Farm Equipment Market, Revenue & Volume, By Type, 2019-2024 ($)
Table 38: North America Farm Equipment Market, Revenue & Volume, By Phase, 2019-2024 ($)
Table 39: South america Farm Equipment Market, Revenue & Volume, By Type, 2019-2024 ($)
Table 40: South america Farm Equipment Market, Revenue & Volume, By Phase, 2019-2024 ($)
Table 41: Europe Farm Equipment Market, Revenue & Volume, By Type, 2019-2024 ($)
Table 42: Europe Farm Equipment Market, Revenue & Volume, By Phase, 2019-2024 ($)
Table 43: APAC Farm Equipment Market, Revenue & Volume, By Type, 2019-2024 ($)
Table 44: APAC Farm Equipment Market, Revenue & Volume, By Phase, 2019-2024 ($)
Table 45: Middle East & Africa Farm Equipment Market, Revenue & Volume, By Type, 2019-2024 ($)
Table 46: Middle East & Africa Farm Equipment Market, Revenue & Volume, By Phase, 2019-2024 ($)
Table 47: Russia Farm Equipment Market, Revenue & Volume, By Type, 2019-2024 ($)
Table 48: Russia Farm Equipment Market, Revenue & Volume, By Phase, 2019-2024 ($)
Table 49: Israel Farm Equipment Market, Revenue & Volume, By Type, 2019-2024 ($)
Table 50: Israel Farm Equipment Market, Revenue & Volume, By Phase, 2019-2024 ($)
Table 51: Top Companies 2018 (US$) Farm Equipment Market, Revenue & Volume
Table 52: Product Launch 2018-2019 Farm Equipment Market, Revenue & Volume
Table 53: Mergers & Acquistions 2018-2019 Farm Equipment Market, Revenue & Volume
List of Figures:
Figure 1: Overview of Farm Equipment Market 2019-2024
Figure 2: Market Share Analysis for Farm Equipment Market 2018 (US$)
Figure 3: Product Comparison in Farm Equipment Market 2018-2019 (US$)
Figure 4: End User Profile for Farm Equipment Market 2018-2019 (US$)
Figure 5: Patent Application and Grant in Farm Equipment Market 2013-2018* (US$)
Figure 6: Top 5 Companies Financial Analysis in Farm Equipment Market 2018-2019 (US$)
Figure 7: Market Entry Strategy in Farm Equipment Market 2018-2019
Figure 8: Ecosystem Analysis in Farm Equipment Market 2018
Figure 9: Average Selling Price in Farm Equipment Market 2019-2024
Figure 10: Top Opportunites in Farm Equipment Market 2018-2019
Figure 11: Market Life Cycle Analysis in Farm Equipment Market
Figure 12: GlobalBy Type Farm Equipment Market Revenue, 2019-2024 ($)
Figure 13: GlobalBy Phase Farm Equipment Market Revenue, 2019-2024 ($)
Figure 14: Global Farm Equipment Market - By Geography
Figure 15: Global Farm Equipment Market Value & Volume, By Geography, 2019-2024 ($)
Figure 16: Global Farm Equipment Market CAGR, By Geography, 2019-2024 (%)
Figure 17: North America Farm Equipment Market Value & Volume, 2019-2024 ($)
Figure 18: US Farm Equipment Market Value & Volume, 2019-2024 ($)
Figure 19: US GDP and Population, 2018-2019 ($)
Figure 20: US GDP – Composition of 2018, By Sector of Origin
Figure 21: US Export and Import Value & Volume, 2018-2019 ($)
Figure 22: Canada Farm Equipment Market Value & Volume, 2019-2024 ($)
Figure 23: Canada GDP and Population, 2018-2019 ($)
Figure 24: Canada GDP – Composition of 2018, By Sector of Origin
Figure 25: Canada Export and Import Value & Volume, 2018-2019 ($)
Figure 26: Mexico Farm Equipment Market Value & Volume, 2019-2024 ($)
Figure 27: Mexico GDP and Population, 2018-2019 ($)
Figure 28: Mexico GDP – Composition of 2018, By Sector of Origin
Figure 29: Mexico Export and Import Value & Volume, 2018-2019 ($)
Figure 30: South America Farm Equipment Market Value & Volume, 2019-2024 ($)
Figure 31: Brazil Farm Equipment Market Value & Volume, 2019-2024 ($)
Figure 32: Brazil GDP and Population, 2018-2019 ($)
Figure 33: Brazil GDP – Composition of 2018, By Sector of Origin
Figure 34: Brazil Export and Import Value & Volume, 2018-2019 ($)
Figure 35: Venezuela Farm Equipment Market Value & Volume, 2019-2024 ($)
Figure 36: Venezuela GDP and Population, 2018-2019 ($)
Figure 37: Venezuela GDP – Composition of 2018, By Sector of Origin
Figure 38: Venezuela Export and Import Value & Volume, 2018-2019 ($)
Figure 39: Argentina Farm Equipment Market Value & Volume, 2019-2024 ($)
Figure 40: Argentina GDP and Population, 2018-2019 ($)
Figure 41: Argentina GDP – Composition of 2018, By Sector of Origin
Figure 42: Argentina Export and Import Value & Volume, 2018-2019 ($)
Figure 43: Ecuador Farm Equipment Market Value & Volume, 2019-2024 ($)
Figure 44: Ecuador GDP and Population, 2018-2019 ($)
Figure 45: Ecuador GDP – Composition of 2018, By Sector of Origin
Figure 46: Ecuador Export and Import Value & Volume, 2018-2019 ($)
Figure 47: Peru Farm Equipment Market Value & Volume, 2019-2024 ($)
Figure 48: Peru GDP and Population, 2018-2019 ($)
Figure 49: Peru GDP – Composition of 2018, By Sector of Origin
Figure 50: Peru Export and Import Value & Volume, 2018-2019 ($)
Figure 51: Colombia Farm Equipment Market Value & Volume, 2019-2024 ($)
Figure 52: Colombia GDP and Population, 2018-2019 ($)
Figure 53: Colombia GDP – Composition of 2018, By Sector of Origin
Figure 54: Colombia Export and Import Value & Volume, 2018-2019 ($)
Figure 55: Costa Rica Farm Equipment Market Value & Volume, 2019-2024 ($)
Figure 56: Costa Rica GDP and Population, 2018-2019 ($)
Figure 57: Costa Rica GDP – Composition of 2018, By Sector of Origin
Figure 58: Costa Rica Export and Import Value & Volume, 2018-2019 ($)
Figure 59: Europe Farm Equipment Market Value & Volume, 2019-2024 ($)
Figure 60: U.K Farm Equipment Market Value & Volume, 2019-2024 ($)
Figure 61: U.K GDP and Population, 2018-2019 ($)
Figure 62: U.K GDP – Composition of 2018, By Sector of Origin
Figure 63: U.K Export and Import Value & Volume, 2018-2019 ($)
Figure 64: Germany Farm Equipment Market Value & Volume, 2019-2024 ($)
Figure 65: Germany GDP and Population, 2018-2019 ($)
Figure 66: Germany GDP – Composition of 2018, By Sector of Origin
Figure 67: Germany Export and Import Value & Volume, 2018-2019 ($)
Figure 68: Italy Farm Equipment Market Value & Volume, 2019-2024 ($)
Figure 69: Italy GDP and Population, 2018-2019 ($)
Figure 70: Italy GDP – Composition of 2018, By Sector of Origin
Figure 71: Italy Export and Import Value & Volume, 2018-2019 ($)
Figure 72: France Farm Equipment Market Value & Volume, 2019-2024 ($)
Figure 73: France GDP and Population, 2018-2019 ($)
Figure 74: France GDP – Composition of 2018, By Sector of Origin
Figure 75: France Export and Import Value & Volume, 2018-2019 ($)
Figure 76: Netherlands Farm Equipment Market Value & Volume, 2019-2024 ($)
Figure 77: Netherlands GDP and Population, 2018-2019 ($)
Figure 78: Netherlands GDP – Composition of 2018, By Sector of Origin
Figure 79: Netherlands Export and Import Value & Volume, 2018-2019 ($)
Figure 80: Belgium Farm Equipment Market Value & Volume, 2019-2024 ($)
Figure 81: Belgium GDP and Population, 2018-2019 ($)
Figure 82: Belgium GDP – Composition of 2018, By Sector of Origin
Figure 83: Belgium Export and Import Value & Volume, 2018-2019 ($)
Figure 84: Spain Farm Equipment Market Value & Volume, 2019-2024 ($)
Figure 85: Spain GDP and Population, 2018-2019 ($)
Figure 86: Spain GDP – Composition of 2018, By Sector of Origin
Figure 87: Spain Export and Import Value & Volume, 2018-2019 ($)
Figure 88: Denmark Farm Equipment Market Value & Volume, 2019-2024 ($)
Figure 89: Denmark GDP and Population, 2018-2019 ($)
Figure 90: Denmark GDP – Composition of 2018, By Sector of Origin
Figure 91: Denmark Export and Import Value & Volume, 2018-2019 ($)
Figure 92: APAC Farm Equipment Market Value & Volume, 2019-2024 ($)
Figure 93: China Farm Equipment Market Value & Volume, 2019-2024
Figure 94: China GDP and Population, 2018-2019 ($)
Figure 95: China GDP – Composition of 2018, By Sector of Origin
Figure 96: China Export and Import Value & Volume, 2018-2019 ($) Farm Equipment Market China Export and Import Value & Volume, 2018-2019 ($)
Figure 97: Australia Farm Equipment Market Value & Volume, 2019-2024 ($)
Figure 98: Australia GDP and Population, 2018-2019 ($)
Figure 99: Australia GDP – Composition of 2018, By Sector of Origin
Figure 100: Australia Export and Import Value & Volume, 2018-2019 ($)
Figure 101: South Korea Farm Equipment Market Value & Volume, 2019-2024 ($)
Figure 102: South Korea GDP and Population, 2018-2019 ($)
Figure 103: South Korea GDP – Composition of 2018, By Sector of Origin
Figure 104: South Korea Export and Import Value & Volume, 2018-2019 ($)
Figure 105: India Farm Equipment Market Value & Volume, 2019-2024 ($)
Figure 106: India GDP and Population, 2018-2019 ($)
Figure 107: India GDP – Composition of 2018, By Sector of Origin
Figure 108: India Export and Import Value & Volume, 2018-2019 ($)
Figure 109: Taiwan Farm Equipment Market Value & Volume, 2019-2024 ($)
Figure 110: Taiwan GDP and Population, 2018-2019 ($)
Figure 111: Taiwan GDP – Composition of 2018, By Sector of Origin
Figure 112: Taiwan Export and Import Value & Volume, 2018-2019 ($)
Figure 113: Malaysia Farm Equipment Market Value & Volume, 2019-2024 ($)
Figure 114: Malaysia GDP and Population, 2018-2019 ($)
Figure 115: Malaysia GDP – Composition of 2018, By Sector of Origin
Figure 116: Malaysia Export and Import Value & Volume, 2018-2019 ($)
Figure 117: Hong Kong Farm Equipment Market Value & Volume, 2019-2024 ($)
Figure 118: Hong Kong GDP and Population, 2018-2019 ($)
Figure 119: Hong Kong GDP – Composition of 2018, By Sector of Origin
Figure 120: Hong Kong Export and Import Value & Volume, 2018-2019 ($)
Figure 121: Middle East & Africa Farm Equipment Market Middle East & Africa 3D Printing Market Value & Volume, 2019-2024 ($)
Figure 122: Russia Farm Equipment Market Value & Volume, 2019-2024 ($)
Figure 123: Russia GDP and Population, 2018-2019 ($)
Figure 124: Russia GDP – Composition of 2018, By Sector of Origin
Figure 125: Russia Export and Import Value & Volume, 2018-2019 ($)
Figure 126: Israel Farm Equipment Market Value & Volume, 2019-2024 ($)
Figure 127: Israel GDP and Population, 2018-2019 ($)
Figure 128: Israel GDP – Composition of 2018, By Sector of Origin
Figure 129: Israel Export and Import Value & Volume, 2018-2019 ($)
Figure 130: Entropy Share, By Strategies, 2018-2019* (%) Farm Equipment Market
Figure 131: Developments, 2018-2019* Farm Equipment Market
Figure 132: Company 1 Farm Equipment Market Net Revenue, By Years, 2018-2019* ($)
Figure 133: Company 1 Farm Equipment Market Net Revenue Share, By Business segments, 2018 (%)
Figure 134: Company 1 Farm Equipment Market Net Sales Share, By Geography, 2018 (%)
Figure 135: Company 2 Farm Equipment Market Net Revenue, By Years, 2018-2019* ($)
Figure 136: Company 2 Farm Equipment Market Net Revenue Share, By Business segments, 2018 (%)
Figure 137: Company 2 Farm Equipment Market Net Sales Share, By Geography, 2018 (%)
Figure 138: Company 3 Farm Equipment Market Net Revenue, By Years, 2018-2019* ($)
Figure 139: Company 3 Farm Equipment Market Net Revenue Share, By Business segments, 2018 (%)
Figure 140: Company 3 Farm Equipment Market Net Sales Share, By Geography, 2018 (%)
Figure 141: Company 4 Farm Equipment Market Net Revenue, By Years, 2018-2019* ($)
Figure 142: Company 4 Farm Equipment Market Net Revenue Share, By Business segments, 2018 (%)
Figure 143: Company 4 Farm Equipment Market Net Sales Share, By Geography, 2018 (%)
Figure 144: Company 5 Farm Equipment Market Net Revenue, By Years, 2018-2019* ($)
Figure 145: Company 5 Farm Equipment Market Net Revenue Share, By Business segments, 2018 (%)
Figure 146: Company 5 Farm Equipment Market Net Sales Share, By Geography, 2018 (%)
Figure 147: Company 6 Farm Equipment Market Net Revenue, By Years, 2018-2019* ($)
Figure 148: Company 6 Farm Equipment Market Net Revenue Share, By Business segments, 2018 (%)
Figure 149: Company 6 Farm Equipment Market Net Sales Share, By Geography, 2018 (%)
Figure 150: Company 7 Farm Equipment Market Net Revenue, By Years, 2018-2019* ($)
Figure 151: Company 7 Farm Equipment Market Net Revenue Share, By Business segments, 2018 (%)
Figure 152: Company 7 Farm Equipment Market Net Sales Share, By Geography, 2018 (%)
Figure 153: Company 8 Farm Equipment Market Net Revenue, By Years, 2018-2019* ($)
Figure 154: Company 8 Farm Equipment Market Net Revenue Share, By Business segments, 2018 (%)
Figure 155: Company 8 Farm Equipment Market Net Sales Share, By Geography, 2018 (%)
Figure 156: Company 9 Farm Equipment Market Net Revenue, By Years, 2018-2019* ($)
Figure 157: Company 9 Farm Equipment Market Net Revenue Share, By Business segments, 2018 (%)
Figure 158: Company 9 Farm Equipment Market Net Sales Share, By Geography, 2018 (%)
Figure 159: Company 10 Farm Equipment Market Net Revenue, By Years, 2018-2019* ($)
Figure 160: Company 10 Farm Equipment Market Net Revenue Share, By Business segments, 2018 (%)
Figure 161: Company 10 Farm Equipment Market Net Sales Share, By Geography, 2018 (%)
Figure 162: Company 11 Farm Equipment Market Net Revenue, By Years, 2018-2019* ($)
Figure 163: Company 11 Farm Equipment Market Net Revenue Share, By Business segments, 2018 (%)
Figure 164: Company 11 Farm Equipment Market Net Sales Share, By Geography, 2018 (%)
Figure 165: Company 12 Farm Equipment Market Net Revenue, By Years, 2018-2019* ($)
Figure 166: Company 12 Farm Equipment Market Net Revenue Share, By Business segments, 2018 (%)
Figure 167: Company 12 Farm Equipment Market Net Sales Share, By Geography, 2018 (%)
Figure 168: Company 13 Farm Equipment Market Net Revenue, By Years, 2018-2019* ($)
Figure 169: Company 13 Farm Equipment Market Net Revenue Share, By Business segments, 2018 (%)
Figure 170: Company 13 Farm Equipment Market Net Sales Share, By Geography, 2018 (%)
Figure 171: Company 14 Farm Equipment Market Net Revenue, By Years, 2018-2019* ($)
Figure 172: Company 14 Farm Equipment Market Net Revenue Share, By Business segments, 2018 (%)
Figure 173: Company 14 Farm Equipment Market Net Sales Share, By Geography, 2018 (%)
Figure 174: Company 15 Farm Equipment Market Net Revenue, By Years, 2018-2019* ($)
Figure 175: Company 15 Farm Equipment Market Net Revenue Share, By Business segments, 2018 (%)
Figure 176: Company 15 Farm Equipment Market Net Sales Share, By Geography, 2018 (%)