 이메일
이메일 인쇄
인쇄


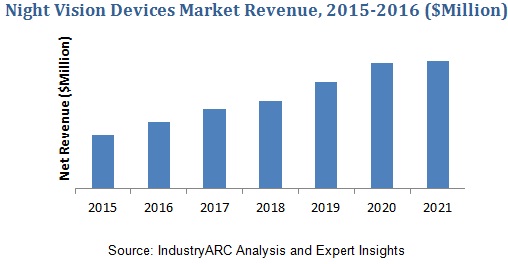
Global Night Vision Devices Market is valued $17,128 million in the year 2017 and is anticipated to grow with a CAGR of 7.0% from the year 2018 to 2023. Night vision devices is segmented based on the different categories in which goggles is valued high and followed by cameras which are having the market share of $7,940 and $7,547 in the year 2017 and is expected to grow with a CAGR of 6.3% and 7.4% respectively from the year 2018 to 2023.
What is Night Vision Device Market?
Night vision device will enable the ability to see in dark or low intensity light Night vision devices has been very prominent in the field of military and defense. The equipment’s such as night vision googles, binoculars and scopes provide assistant to solider during dark. Night vision devices has been segmented based on the components used. The different components used in night vision devices are image intensifier tubes, front lens, photo cathode, eyepiece and many more. Image intensifier tubes are capable of detecting and amplifying low level images formed by weak emissions. Photo electrode is negatively charged electrode used in light detecting devices such as image intensifier, phototube which is coated with photosensitive compound.
What are the major applications for Night Vision Device Market?
The major applications of night vision device market includes research institutions, material testing, hunting, security, navigation, wild life observation. Soldiers use night vision devices while defending an area or while scanning for opposition.
Market Research and Market Trends of Night Vision Device Market:
- The Ring Spotlight Cam monitors homes, allowing users to see, hear, and speak to anyone on the property from a phone, tablet, or PC. It offers 1080HD video, a wide-angle camera lens, a built-in microphone and speakers, and infrared night vision sensors.
- Recently IBM has received a patent for inventing a technology in Google Glass. A red-color projector is included for each eyeglass lens. When the Google glass user enters a low-light environment the projectors automatically project red light into each eye. This glasses projects a higher contrast images giving the glasses a night vision googles kind of a feel.
- BAE system announced a new type of headset that combined night vision and thermal imaging technologies. The new goggle which is attached to a weapon stream a live video feed from the thermal weapon sight via Bluetooth. By integrated night vision and thermal imaging capabilities into one displays the view on the goggle, this headset will enhance the soldier’s capabilities of acquiring and engaging targets.
- The snooper scope smartphone attachment is night vision lens which can be that attached to a cellphones camera to let users have expert vision while in the dark. The device is directly attached on to smartphones making it an affordable attachment to have in the place of a set of expensive binoculars. This device can be easily dismounted after the use.
Who are the Major Players in Industry and Factory Automation market?
The companies referred in the market research report includes ABB Ltd, Emerson electronic Co, Siemens AG, Kuka AG, fanuc Corporation, Schneider Electric SE, Yokogawa Electric Corporation and more than 10 other companies.
What is our report scope?
The report incorporates in-depth assessment of the competitive landscape, product market sizing, product benchmarking, market trends, product developments, financial analysis, strategic analysis and so on to gauge the impact forces and potential opportunities of the market. Apart from this the report also includes a study of major developments in the market such as product launches, agreements, acquisitions, collaborations, mergers and so on to comprehend the prevailing market dynamics at present and its impact during the forecast period 2018-2023.
All our reports are customizable to your company needs to a certain extent, we do provide 20 free consulting hours along with purchase of each report, and this will allow you to request any additional data to customize the report to your needs.
Key Takeaways from this Report
- Evaluate market potential through analyzing growth rates (CAGR %), Volume (Units) and Value ($M) data given at country level – for product types, end use applications and by different industry verticals.
- Understand the different dynamics influencing the market – key driving factors, challenges and hidden opportunities.
- Get in-depth insights on your competitor performance – market shares, strategies, financial benchmarking, product benchmarking, SWOT and more.
- Analyze the sales and distribution channels across key geographies to improve top-line revenues.
- Understand the industry supply chain with a deep-dive on the value augmentation at each step, in order to optimize value and bring efficiencies in your processes.
- Get a quick outlook on the market entropy – M&A’s, deals, partnerships, product launches of all key players for the past 4 years.
- Evaluate the supply-demand gaps, import-export statistics and regulatory landscape for more than top 20 countries globally for the market.
1. Night Vision Devices Market - Overview
1.1. Definitions and Scope
2. Night Vision Devices Market - Executive summary
2.1. Market Revenue, Market Size and Key Trends by Company
2.2. Key Trends by type of Application
2.3. Key Trends segmented by Geography
3. Night Vision Devices Market
3.1. Comparative analysis
3.1.1. Product Benchmarking - Top 10 companies
3.1.2. Top 5 Financials Analysis
3.1.3. Market Value split by Top 10 companies
3.1.4. Patent Analysis - Top 10 companies
3.1.5. Pricing Analysis
4. Night Vision Devices Market – Startup companies Scenario Premium
4.1. Top 10 startup company Analysis by
4.1.1. Investment
4.1.2. Revenue
4.1.3. Market Shares
4.1.4. Market Size and Application Analysis
4.1.5. Venture Capital and Funding Scenario
5. Night Vision Devices Market – Industry Market Entry Scenario Premium
5.1. Regulatory Framework Overview
5.2. New Business and Ease of Doing business index
5.3. Case studies of successful ventures
5.4. Customer Analysis – Top 10 companies
6. Night Vision Devices Market Forces
6.1. Drivers
6.2. Constraints
6.3. Challenges
6.4. Porters five force model
6.4.1. Bargaining power of suppliers
6.4.2. Bargaining powers of customers
6.4.3. Threat of new entrants
6.4.4. Rivalry among existing players
6.4.5. Threat of substitutes
7. Night Vision Devices Market -Strategic analysis
7.1. Value chain analysis
7.2. Opportunities analysis
7.3. Product life cycle
7.4. Suppliers and distributors Market Share
8. Night Vision Devices Market – By Category (Market Size -$Million / $Billion)
8.1. Market Size and Market Share Analysis
8.2. Application Revenue and Trend Research
8.3. Product Segment Analysis
8.3.1. Scopes
8.3.2. Goggles
8.3.2.1. Cyclops Goggles
8.3.2.2. Cats Eyes goggles
8.3.3. Cameras
8.3.4. Binoculars
8.3.5. Monoculars
8.3.6. Others
9. Night Vision Devices Market – By Components (Market Size -$Million / $Billion)
9.1. Introduction
9.2. Image intensifier tubes
9.3. Front Lens
9.4. Photo cathode
9.5. Micro Channel Plate
9.6. High Voltage Power supply
9.7. Phosphor Screen
9.8. Eyepiece
9.9. Others
10. Night Vision Devices Market – By Applications (Market Size -$Million / $Billion)
10.1. Law Enforcement
10.2. Hunting
10.3. Wild Life observation
10.4. Surveillance
10.5. Security
10.6. Navigation
10.7. Hidden object detection
10.8. Entertainment
10.9. Paranormal research
10.10. Material testing
10.11. Others
11. Night Vision Devices Market – By Technology (Market Size -$Million / $Billion)
11.1. Low Light Imaging Process
11.2. Thermal Imaging Process
11.2.1. Cooled thermal imaging camera
11.2.2. Uncooled thermal imaging camera
11.3. Infrared illumination
12. Night Vision Devices – By End Users(Market Size -$Million / $Billion)
12.1. Segment type Size and Market Share Analysis
12.2. Application Revenue and Trends by type of Application
12.3. Application Segment Analysis by Type
12.3.1. Military
12.3.2. Automotive
12.3.3. Aerospace
12.3.4. Defense
12.3.5. Government
13. Night Vision Devices - By Geography (Market Size -$Million / $Billion)
13.1. Night Vision Devices Market - North America Segment Research
13.2. North America Market Research (Million / $Billion)
13.2.1. Segment type Size and Market Size Analysis
13.2.2. Revenue and Trends
13.2.3. Application Revenue and Trends by type of Application
13.2.4. Company Revenue and Product Analysis
13.2.5. North America Product type and Application Market Size
13.2.5.1. U.S.
13.2.5.2. Canada
13.2.5.3. Mexico
13.2.5.4. Rest of North America
13.3. Night Vision Devices - South America Segment Research
13.4. South America Market Research (Market Size -$Million / $Billion)
13.4.1. Segment type Size and Market Size Analysis
13.4.2. Revenue and Trends
13.4.3. Application Revenue and Trends by type of Application
13.4.4. Company Revenue and Product Analysis
13.4.5. South America Product type and Application Market Size
13.4.5.1. Brazil
13.4.5.2. Venezuela
13.4.5.3. Argentina
13.4.5.4. Ecuador
13.4.5.5. Peru
13.4.5.6. Colombia
13.4.5.7. Costa Rica
13.4.5.8. Rest of South America
13.5. Night Vision Devices - Europe Segment Research
13.6. Europe Market Research (Market Size -$Million / $Billion)
13.6.1. Segment type Size and Market Size Analysis
13.6.2. Revenue and Trends
13.6.3. Application Revenue and Trends by type of Application
13.6.4. Company Revenue and Product Analysis
13.6.5. Europe Segment Product type and Application Market Size
13.6.5.1. U.K
13.6.5.2. Germany
13.6.5.3. Italy
13.6.5.4. France
13.6.5.5. Netherlands
13.6.5.6. Belgium
13.6.5.7. Spain
13.6.5.8. Denmark
13.6.5.9. Rest of Europe
13.7. Night Vision Devices – APAC Segment Research
13.8. APAC Market Research (Market Size -$Million / $Billion)
13.8.1. Segment type Size and Market Size Analysis
13.8.2. Revenue and Trends
13.8.3. Application Revenue and Trends by type of Application
13.8.4. Company Revenue and Product Analysis
13.8.5. APAC Segment – Product type and Application Market Size
13.8.5.1. China
13.8.5.2. Australia
13.8.5.3. Japan
13.8.5.4. South Korea
13.8.5.5. India
13.8.5.6. Taiwan
13.8.5.7. Malaysia
14. Night Vision Devices Market - Entropy
14.1. New product launches
14.2. M&A's, collaborations, JVs and partnerships
15. Night Vision Devices Market – Industry / Segment Competition landscape Premium
15.1. Market Share Analysis
15.1.1. Market Share by Country- Top companies
15.1.2. Market Share by Region- Top 10 companies
15.1.3. Market Share by type of Application – Top 10 companies
15.1.4. Market Share by type of Product / Product category- Top 10 companies
15.1.5. Market Share at global level- Top 10 companies
15.1.6. Best Practises for companies
16. Night Vision Devices Market – Key Company List by Country Premium
17. Night Vision Devices Market Company Analysis
17.1. Market Share, Company Revenue, Products, M&A, Developments
17.2. ATN Corp. (U.S)
17.3. Exelis Inc. (U.S)
17.4. FLIR Systems, Inc. (U.S)
17.5. Raytheon Co. (U.S)
17.6. L3 Communications Holding, Inc
17.7. Company 6
17.8. Company 7
17.9. Company 8
17.10. Company 9
17.11. Company 10 and more
"*Financials would be provided on a best efforts basis for private companies"
18. Night Vision Devices Market -Appendix
18.1. Abbreviations
18.2. Sources
19. Night Vision Devices Market -Methodology Premium
19.1. Research Methodology
19.1.1. Company Expert Interviews
19.1.2. Industry Databases
19.1.3. Associations
19.1.4. Company News
19.1.5. Company Annual Reports
19.1.6. Application Trends
19.1.7. New Products and Product database
19.1.8. Company Transcripts
19.1.9. R&D Trends
19.1.10. Key Opinion Leaders Interviews
19.1.11. Supply and Demand Trends
List of Tables:
Table 1: Night Vision Devices Market Overview 2019-2024
Table 2: Night Vision Devices Market Leader Analysis 2018-2019 (US$)
Table 3: Night Vision Devices Market Product Analysis 2018-2019 (US$)
Table 4: Night Vision Devices Market End User Analysis 2018-2019 (US$)
Table 5: Night Vision Devices Market Patent Analysis 2013-2018* (US$)
Table 6: Night Vision Devices Market Financial Analysis 2018-2019 (US$)
Table 7: Night Vision Devices Market Driver Analysis 2018-2019 (US$)
Table 8: Night Vision Devices Market Challenges Analysis 2018-2019 (US$)
Table 9: Night Vision Devices Market Constraint Analysis 2018-2019 (US$)
Table 10: Night Vision Devices Market Supplier Bargaining Power Analysis 2018-2019 (US$)
Table 11: Night Vision Devices Market Buyer Bargaining Power Analysis 2018-2019 (US$)
Table 12: Night Vision Devices Market Threat of Substitutes Analysis 2018-2019 (US$)
Table 13: Night Vision Devices Market Threat of New Entrants Analysis 2018-2019 (US$)
Table 14: Night Vision Devices Market Degree of Competition Analysis 2018-2019 (US$)
Table 15: Night Vision Devices Market Value Chain Analysis 2018-2019 (US$)
Table 16: Night Vision Devices Market Pricing Analysis 2019-2024 (US$)
Table 17: Night Vision Devices Market Opportunities Analysis 2019-2024 (US$)
Table 18: Night Vision Devices Market Product Life Cycle Analysis 2019-2024 (US$)
Table 19: Night Vision Devices Market Supplier Analysis 2018-2019 (US$)
Table 20: Night Vision Devices Market Distributor Analysis 2018-2019 (US$)
Table 21: Night Vision Devices Market Trend Analysis 2018-2019 (US$)
Table 22: Night Vision Devices Market Size 2018 (US$)
Table 23: Night Vision Devices Market Forecast Analysis 2019-2024 (US$)
Table 24: Night Vision Devices Market Sales Forecast Analysis 2019-2024 (Units)
Table 25: Night Vision Devices Market, Revenue & Volume, By Category, 2019-2024 ($)
Table 26: Night Vision Devices Market By Category, Revenue & Volume, By Scopes, 2019-2024 ($)
Table 27: Night Vision Devices Market By Category, Revenue & Volume, By Goggles, 2019-2024 ($)
Table 28: Night Vision Devices Market By Category, Revenue & Volume, By Cameras, 2019-2024 ($)
Table 29: Night Vision Devices Market By Category, Revenue & Volume, By Binoculars, 2019-2024 ($)
Table 30: Night Vision Devices Market By Category, Revenue & Volume, By Monoculars, 2019-2024 ($)
Table 31: Night Vision Devices Market, Revenue & Volume, By Components, 2019-2024 ($)
Table 32: Night Vision Devices Market By Components, Revenue & Volume, By Image intensifier tubes, 2019-2024 ($)
Table 33: Night Vision Devices Market By Components, Revenue & Volume, By Front Lens, 2019-2024 ($)
Table 34: Night Vision Devices Market By Components, Revenue & Volume, By Photo cathode, 2019-2024 ($)
Table 35: Night Vision Devices Market By Components, Revenue & Volume, By Micro Channel Plate, 2019-2024 ($)
Table 36: Night Vision Devices Market By Components, Revenue & Volume, By High Voltage Power supply, 2019-2024 ($)
Table 37: Night Vision Devices Market, Revenue & Volume, By Applications, 2019-2024 ($)
Table 38: Night Vision Devices Market By Applications, Revenue & Volume, By Law Enforcement, 2019-2024 ($)
Table 39: Night Vision Devices Market By Applications, Revenue & Volume, By Hunting, 2019-2024 ($)
Table 40: Night Vision Devices Market By Applications, Revenue & Volume, By Wild Life observation, 2019-2024 ($)
Table 41: Night Vision Devices Market By Applications, Revenue & Volume, By Surveillance, 2019-2024 ($)
Table 42: Night Vision Devices Market By Applications, Revenue & Volume, By Security, 2019-2024 ($)
Table 43: Night Vision Devices Market, Revenue & Volume, By Technology, 2019-2024 ($)
Table 44: Night Vision Devices Market By Technology, Revenue & Volume, By Low Light Imaging Process, 2019-2024 ($)
Table 45: Night Vision Devices Market By Technology, Revenue & Volume, By Thermal Imaging Process, 2019-2024 ($)
Table 46: Night Vision Devices Market, Revenue & Volume, By End users, 2019-2024 ($)
Table 47: Night Vision Devices Market By End users, Revenue & Volume, By Military, 2019-2024 ($)
Table 48: Night Vision Devices Market By End users, Revenue & Volume, By Automotive, 2019-2024 ($)
Table 49: Night Vision Devices Market By End users, Revenue & Volume, By Aerospace, 2019-2024 ($)
Table 50: Night Vision Devices Market By End users, Revenue & Volume, By Defense, 2019-2024 ($)
Table 51: Night Vision Devices Market By End users, Revenue & Volume, By Government, 2019-2024 ($)
Table 52: North America Night Vision Devices Market, Revenue & Volume, By Category, 2019-2024 ($)
Table 53: North America Night Vision Devices Market, Revenue & Volume, By Components, 2019-2024 ($)
Table 54: North America Night Vision Devices Market, Revenue & Volume, By Applications, 2019-2024 ($)
Table 55: North America Night Vision Devices Market, Revenue & Volume, By Technology, 2019-2024 ($)
Table 56: North America Night Vision Devices Market, Revenue & Volume, By End users, 2019-2024 ($)
Table 57: South america Night Vision Devices Market, Revenue & Volume, By Category, 2019-2024 ($)
Table 58: South america Night Vision Devices Market, Revenue & Volume, By Components, 2019-2024 ($)
Table 59: South america Night Vision Devices Market, Revenue & Volume, By Applications, 2019-2024 ($)
Table 60: South america Night Vision Devices Market, Revenue & Volume, By Technology, 2019-2024 ($)
Table 61: South america Night Vision Devices Market, Revenue & Volume, By End users, 2019-2024 ($)
Table 62: Europe Night Vision Devices Market, Revenue & Volume, By Category, 2019-2024 ($)
Table 63: Europe Night Vision Devices Market, Revenue & Volume, By Components, 2019-2024 ($)
Table 64: Europe Night Vision Devices Market, Revenue & Volume, By Applications, 2019-2024 ($)
Table 65: Europe Night Vision Devices Market, Revenue & Volume, By Technology, 2019-2024 ($)
Table 66: Europe Night Vision Devices Market, Revenue & Volume, By End users, 2019-2024 ($)
Table 67: APAC Night Vision Devices Market, Revenue & Volume, By Category, 2019-2024 ($)
Table 68: APAC Night Vision Devices Market, Revenue & Volume, By Components, 2019-2024 ($)
Table 69: APAC Night Vision Devices Market, Revenue & Volume, By Applications, 2019-2024 ($)
Table 70: APAC Night Vision Devices Market, Revenue & Volume, By Technology, 2019-2024 ($)
Table 71: APAC Night Vision Devices Market, Revenue & Volume, By End users, 2019-2024 ($)
Table 72: Middle East & Africa Night Vision Devices Market, Revenue & Volume, By Category, 2019-2024 ($)
Table 73: Middle East & Africa Night Vision Devices Market, Revenue & Volume, By Components, 2019-2024 ($)
Table 74: Middle East & Africa Night Vision Devices Market, Revenue & Volume, By Applications, 2019-2024 ($)
Table 75: Middle East & Africa Night Vision Devices Market, Revenue & Volume, By Technology, 2019-2024 ($)
Table 76: Middle East & Africa Night Vision Devices Market, Revenue & Volume, By End users, 2019-2024 ($)
Table 77: Russia Night Vision Devices Market, Revenue & Volume, By Category, 2019-2024 ($)
Table 78: Russia Night Vision Devices Market, Revenue & Volume, By Components, 2019-2024 ($)
Table 79: Russia Night Vision Devices Market, Revenue & Volume, By Applications, 2019-2024 ($)
Table 80: Russia Night Vision Devices Market, Revenue & Volume, By Technology, 2019-2024 ($)
Table 81: Russia Night Vision Devices Market, Revenue & Volume, By End users, 2019-2024 ($)
Table 82: Israel Night Vision Devices Market, Revenue & Volume, By Category, 2019-2024 ($)
Table 83: Israel Night Vision Devices Market, Revenue & Volume, By Components, 2019-2024 ($)
Table 84: Israel Night Vision Devices Market, Revenue & Volume, By Applications, 2019-2024 ($)
Table 85: Israel Night Vision Devices Market, Revenue & Volume, By Technology, 2019-2024 ($)
Table 86: Israel Night Vision Devices Market, Revenue & Volume, By End users, 2019-2024 ($)
Table 87: Top Companies 2018 (US$) Night Vision Devices Market, Revenue & Volume
Table 88: Product Launch 2018-2019 Night Vision Devices Market, Revenue & Volume
Table 89: Mergers & Acquistions 2018-2019 Night Vision Devices Market, Revenue & Volume
List of Figures:
Figure 1: Overview of Night Vision Devices Market 2019-2024
Figure 2: Market Share Analysis for Night Vision Devices Market 2018 (US$)
Figure 3: Product Comparison in Night Vision Devices Market 2018-2019 (US$)
Figure 4: End User Profile for Night Vision Devices Market 2018-2019 (US$)
Figure 5: Patent Application and Grant in Night Vision Devices Market 2013-2018* (US$)
Figure 6: Top 5 Companies Financial Analysis in Night Vision Devices Market 2018-2019 (US$)
Figure 7: Market Entry Strategy in Night Vision Devices Market 2018-2019
Figure 8: Ecosystem Analysis in Night Vision Devices Market 2018
Figure 9: Average Selling Price in Night Vision Devices Market 2019-2024
Figure 10: Top Opportunites in Night Vision Devices Market 2018-2019
Figure 11: Market Life Cycle Analysis in Night Vision Devices Market
Figure 12: GlobalBy Category Night Vision Devices Market Revenue, 2019-2024 ($)
Figure 13: GlobalBy Components Night Vision Devices Market Revenue, 2019-2024 ($)
Figure 14: GlobalBy Applications Night Vision Devices Market Revenue, 2019-2024 ($)
Figure 15: GlobalBy Technology Night Vision Devices Market Revenue, 2019-2024 ($)
Figure 16: GlobalBy End users Night Vision Devices Market Revenue, 2019-2024 ($)
Figure 17: Global Night Vision Devices Market - By Geography
Figure 18: Global Night Vision Devices Market Value & Volume, By Geography, 2019-2024 ($)
Figure 19: Global Night Vision Devices Market CAGR, By Geography, 2019-2024 (%)
Figure 20: North America Night Vision Devices Market Value & Volume, 2019-2024 ($)
Figure 21: US Night Vision Devices Market Value & Volume, 2019-2024 ($)
Figure 22: US GDP and Population, 2018-2019 ($)
Figure 23: US GDP – Composition of 2018, By Sector of Origin
Figure 24: US Export and Import Value & Volume, 2018-2019 ($)
Figure 25: Canada Night Vision Devices Market Value & Volume, 2019-2024 ($)
Figure 26: Canada GDP and Population, 2018-2019 ($)
Figure 27: Canada GDP – Composition of 2018, By Sector of Origin
Figure 28: Canada Export and Import Value & Volume, 2018-2019 ($)
Figure 29: Mexico Night Vision Devices Market Value & Volume, 2019-2024 ($)
Figure 30: Mexico GDP and Population, 2018-2019 ($)
Figure 31: Mexico GDP – Composition of 2018, By Sector of Origin
Figure 32: Mexico Export and Import Value & Volume, 2018-2019 ($)
Figure 33: South America Night Vision Devices Market Value & Volume, 2019-2024 ($)
Figure 34: Brazil Night Vision Devices Market Value & Volume, 2019-2024 ($)
Figure 35: Brazil GDP and Population, 2018-2019 ($)
Figure 36: Brazil GDP – Composition of 2018, By Sector of Origin
Figure 37: Brazil Export and Import Value & Volume, 2018-2019 ($)
Figure 38: Venezuela Night Vision Devices Market Value & Volume, 2019-2024 ($)
Figure 39: Venezuela GDP and Population, 2018-2019 ($)
Figure 40: Venezuela GDP – Composition of 2018, By Sector of Origin
Figure 41: Venezuela Export and Import Value & Volume, 2018-2019 ($)
Figure 42: Argentina Night Vision Devices Market Value & Volume, 2019-2024 ($)
Figure 43: Argentina GDP and Population, 2018-2019 ($)
Figure 44: Argentina GDP – Composition of 2018, By Sector of Origin
Figure 45: Argentina Export and Import Value & Volume, 2018-2019 ($)
Figure 46: Ecuador Night Vision Devices Market Value & Volume, 2019-2024 ($)
Figure 47: Ecuador GDP and Population, 2018-2019 ($)
Figure 48: Ecuador GDP – Composition of 2018, By Sector of Origin
Figure 49: Ecuador Export and Import Value & Volume, 2018-2019 ($)
Figure 50: Peru Night Vision Devices Market Value & Volume, 2019-2024 ($)
Figure 51: Peru GDP and Population, 2018-2019 ($)
Figure 52: Peru GDP – Composition of 2018, By Sector of Origin
Figure 53: Peru Export and Import Value & Volume, 2018-2019 ($)
Figure 54: Colombia Night Vision Devices Market Value & Volume, 2019-2024 ($)
Figure 55: Colombia GDP and Population, 2018-2019 ($)
Figure 56: Colombia GDP – Composition of 2018, By Sector of Origin
Figure 57: Colombia Export and Import Value & Volume, 2018-2019 ($)
Figure 58: Costa Rica Night Vision Devices Market Value & Volume, 2019-2024 ($)
Figure 59: Costa Rica GDP and Population, 2018-2019 ($)
Figure 60: Costa Rica GDP – Composition of 2018, By Sector of Origin
Figure 61: Costa Rica Export and Import Value & Volume, 2018-2019 ($)
Figure 62: Europe Night Vision Devices Market Value & Volume, 2019-2024 ($)
Figure 63: U.K Night Vision Devices Market Value & Volume, 2019-2024 ($)
Figure 64: U.K GDP and Population, 2018-2019 ($)
Figure 65: U.K GDP – Composition of 2018, By Sector of Origin
Figure 66: U.K Export and Import Value & Volume, 2018-2019 ($)
Figure 67: Germany Night Vision Devices Market Value & Volume, 2019-2024 ($)
Figure 68: Germany GDP and Population, 2018-2019 ($)
Figure 69: Germany GDP – Composition of 2018, By Sector of Origin
Figure 70: Germany Export and Import Value & Volume, 2018-2019 ($)
Figure 71: Italy Night Vision Devices Market Value & Volume, 2019-2024 ($)
Figure 72: Italy GDP and Population, 2018-2019 ($)
Figure 73: Italy GDP – Composition of 2018, By Sector of Origin
Figure 74: Italy Export and Import Value & Volume, 2018-2019 ($)
Figure 75: France Night Vision Devices Market Value & Volume, 2019-2024 ($)
Figure 76: France GDP and Population, 2018-2019 ($)
Figure 77: France GDP – Composition of 2018, By Sector of Origin
Figure 78: France Export and Import Value & Volume, 2018-2019 ($)
Figure 79: Netherlands Night Vision Devices Market Value & Volume, 2019-2024 ($)
Figure 80: Netherlands GDP and Population, 2018-2019 ($)
Figure 81: Netherlands GDP – Composition of 2018, By Sector of Origin
Figure 82: Netherlands Export and Import Value & Volume, 2018-2019 ($)
Figure 83: Belgium Night Vision Devices Market Value & Volume, 2019-2024 ($)
Figure 84: Belgium GDP and Population, 2018-2019 ($)
Figure 85: Belgium GDP – Composition of 2018, By Sector of Origin
Figure 86: Belgium Export and Import Value & Volume, 2018-2019 ($)
Figure 87: Spain Night Vision Devices Market Value & Volume, 2019-2024 ($)
Figure 88: Spain GDP and Population, 2018-2019 ($)
Figure 89: Spain GDP – Composition of 2018, By Sector of Origin
Figure 90: Spain Export and Import Value & Volume, 2018-2019 ($)
Figure 91: Denmark Night Vision Devices Market Value & Volume, 2019-2024 ($)
Figure 92: Denmark GDP and Population, 2018-2019 ($)
Figure 93: Denmark GDP – Composition of 2018, By Sector of Origin
Figure 94: Denmark Export and Import Value & Volume, 2018-2019 ($)
Figure 95: APAC Night Vision Devices Market Value & Volume, 2019-2024 ($)
Figure 96: China Night Vision Devices Market Value & Volume, 2019-2024
Figure 97: China GDP and Population, 2018-2019 ($)
Figure 98: China GDP – Composition of 2018, By Sector of Origin
Figure 99: China Export and Import Value & Volume, 2018-2019 ($) Night Vision Devices Market China Export and Import Value & Volume, 2018-2019 ($)
Figure 100: Australia Night Vision Devices Market Value & Volume, 2019-2024 ($)
Figure 101: Australia GDP and Population, 2018-2019 ($)
Figure 102: Australia GDP – Composition of 2018, By Sector of Origin
Figure 103: Australia Export and Import Value & Volume, 2018-2019 ($)
Figure 104: South Korea Night Vision Devices Market Value & Volume, 2019-2024 ($)
Figure 105: South Korea GDP and Population, 2018-2019 ($)
Figure 106: South Korea GDP – Composition of 2018, By Sector of Origin
Figure 107: South Korea Export and Import Value & Volume, 2018-2019 ($)
Figure 108: India Night Vision Devices Market Value & Volume, 2019-2024 ($)
Figure 109: India GDP and Population, 2018-2019 ($)
Figure 110: India GDP – Composition of 2018, By Sector of Origin
Figure 111: India Export and Import Value & Volume, 2018-2019 ($)
Figure 112: Taiwan Night Vision Devices Market Value & Volume, 2019-2024 ($)
Figure 113: Taiwan GDP and Population, 2018-2019 ($)
Figure 114: Taiwan GDP – Composition of 2018, By Sector of Origin
Figure 115: Taiwan Export and Import Value & Volume, 2018-2019 ($)
Figure 116: Malaysia Night Vision Devices Market Value & Volume, 2019-2024 ($)
Figure 117: Malaysia GDP and Population, 2018-2019 ($)
Figure 118: Malaysia GDP – Composition of 2018, By Sector of Origin
Figure 119: Malaysia Export and Import Value & Volume, 2018-2019 ($)
Figure 120: Hong Kong Night Vision Devices Market Value & Volume, 2019-2024 ($)
Figure 121: Hong Kong GDP and Population, 2018-2019 ($)
Figure 122: Hong Kong GDP – Composition of 2018, By Sector of Origin
Figure 123: Hong Kong Export and Import Value & Volume, 2018-2019 ($)
Figure 124: Middle East & Africa Night Vision Devices Market Middle East & Africa 3D Printing Market Value & Volume, 2019-2024 ($)
Figure 125: Russia Night Vision Devices Market Value & Volume, 2019-2024 ($)
Figure 126: Russia GDP and Population, 2018-2019 ($)
Figure 127: Russia GDP – Composition of 2018, By Sector of Origin
Figure 128: Russia Export and Import Value & Volume, 2018-2019 ($)
Figure 129: Israel Night Vision Devices Market Value & Volume, 2019-2024 ($)
Figure 130: Israel GDP and Population, 2018-2019 ($)
Figure 131: Israel GDP – Composition of 2018, By Sector of Origin
Figure 132: Israel Export and Import Value & Volume, 2018-2019 ($)
Figure 133: Entropy Share, By Strategies, 2018-2019* (%) Night Vision Devices Market
Figure 134: Developments, 2018-2019* Night Vision Devices Market
Figure 135: Company 1 Night Vision Devices Market Net Revenue, By Years, 2018-2019* ($)
Figure 136: Company 1 Night Vision Devices Market Net Revenue Share, By Business segments, 2018 (%)
Figure 137: Company 1 Night Vision Devices Market Net Sales Share, By Geography, 2018 (%)
Figure 138: Company 2 Night Vision Devices Market Net Revenue, By Years, 2018-2019* ($)
Figure 139: Company 2 Night Vision Devices Market Net Revenue Share, By Business segments, 2018 (%)
Figure 140: Company 2 Night Vision Devices Market Net Sales Share, By Geography, 2018 (%)
Figure 141: Company 3 Night Vision Devices Market Net Revenue, By Years, 2018-2019* ($)
Figure 142: Company 3 Night Vision Devices Market Net Revenue Share, By Business segments, 2018 (%)
Figure 143: Company 3 Night Vision Devices Market Net Sales Share, By Geography, 2018 (%)
Figure 144: Company 4 Night Vision Devices Market Net Revenue, By Years, 2018-2019* ($)
Figure 145: Company 4 Night Vision Devices Market Net Revenue Share, By Business segments, 2018 (%)
Figure 146: Company 4 Night Vision Devices Market Net Sales Share, By Geography, 2018 (%)
Figure 147: Company 5 Night Vision Devices Market Net Revenue, By Years, 2018-2019* ($)
Figure 148: Company 5 Night Vision Devices Market Net Revenue Share, By Business segments, 2018 (%)
Figure 149: Company 5 Night Vision Devices Market Net Sales Share, By Geography, 2018 (%)
Figure 150: Company 6 Night Vision Devices Market Net Revenue, By Years, 2018-2019* ($)
Figure 151: Company 6 Night Vision Devices Market Net Revenue Share, By Business segments, 2018 (%)
Figure 152: Company 6 Night Vision Devices Market Net Sales Share, By Geography, 2018 (%)
Figure 153: Company 7 Night Vision Devices Market Net Revenue, By Years, 2018-2019* ($)
Figure 154: Company 7 Night Vision Devices Market Net Revenue Share, By Business segments, 2018 (%)
Figure 155: Company 7 Night Vision Devices Market Net Sales Share, By Geography, 2018 (%)
Figure 156: Company 8 Night Vision Devices Market Net Revenue, By Years, 2018-2019* ($)
Figure 157: Company 8 Night Vision Devices Market Net Revenue Share, By Business segments, 2018 (%)
Figure 158: Company 8 Night Vision Devices Market Net Sales Share, By Geography, 2018 (%)
Figure 159: Company 9 Night Vision Devices Market Net Revenue, By Years, 2018-2019* ($)
Figure 160: Company 9 Night Vision Devices Market Net Revenue Share, By Business segments, 2018 (%)
Figure 161: Company 9 Night Vision Devices Market Net Sales Share, By Geography, 2018 (%)
Figure 162: Company 10 Night Vision Devices Market Net Revenue, By Years, 2018-2019* ($)
Figure 163: Company 10 Night Vision Devices Market Net Revenue Share, By Business segments, 2018 (%)
Figure 164: Company 10 Night Vision Devices Market Net Sales Share, By Geography, 2018 (%)
Figure 165: Company 11 Night Vision Devices Market Net Revenue, By Years, 2018-2019* ($)
Figure 166: Company 11 Night Vision Devices Market Net Revenue Share, By Business segments, 2018 (%)
Figure 167: Company 11 Night Vision Devices Market Net Sales Share, By Geography, 2018 (%)
Figure 168: Company 12 Night Vision Devices Market Net Revenue, By Years, 2018-2019* ($)
Figure 169: Company 12 Night Vision Devices Market Net Revenue Share, By Business segments, 2018 (%)
Figure 170: Company 12 Night Vision Devices Market Net Sales Share, By Geography, 2018 (%)
Figure 171: Company 13 Night Vision Devices Market Net Revenue, By Years, 2018-2019* ($)
Figure 172: Company 13 Night Vision Devices Market Net Revenue Share, By Business segments, 2018 (%)
Figure 173: Company 13 Night Vision Devices Market Net Sales Share, By Geography, 2018 (%)
Figure 174: Company 14 Night Vision Devices Market Net Revenue, By Years, 2018-2019* ($)
Figure 175: Company 14 Night Vision Devices Market Net Revenue Share, By Business segments, 2018 (%)
Figure 176: Company 14 Night Vision Devices Market Net Sales Share, By Geography, 2018 (%)
Figure 177: Company 15 Night Vision Devices Market Net Revenue, By Years, 2018-2019* ($)
Figure 178: Company 15 Night Vision Devices Market Net Revenue Share, By Business segments, 2018 (%)
Figure 179: Company 15 Night Vision Devices Market Net Sales Share, By Geography, 2018 (%)